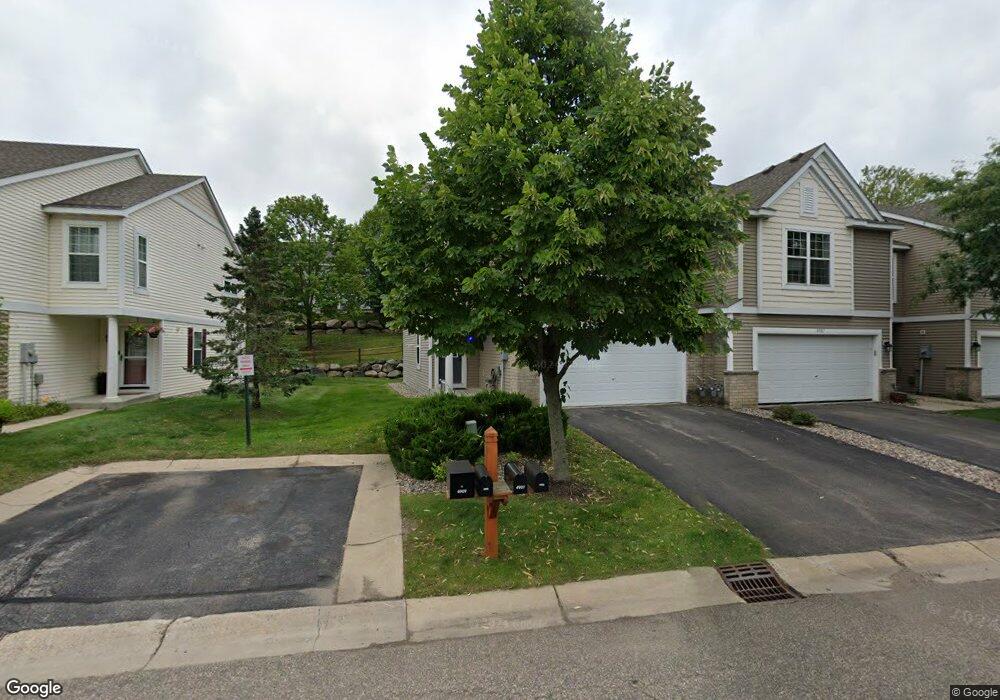
4909 Bluff Heights Trail SE Prior Lake, MN 55372
Estimated Value: $277,754 - $313,000
3
Beds
3
Baths
1,076
Sq Ft
$272/Sq Ft
Est. Value
About This Home
This home is located at 4909 Bluff Heights Trail SE, Prior Lake, MN 55372 and is currently estimated at $292,939, approximately $272 per square foot. 4909 Bluff Heights Trail SE is a home located in Scott County with nearby schools including Westwood Elementary School, Hidden Oaks Middle School, and Twin Oaks Middle School.
Ownership History
Date
Name
Owned For
Owner Type
Purchase Details
Closed on
Jan 17, 2022
Sold by
Anderson and Brent
Bought by
Anderson Lynn
Current Estimated Value
Home Financials for this Owner
Home Financials are based on the most recent Mortgage that was taken out on this home.
Original Mortgage
$173,250
Outstanding Balance
$136,534
Interest Rate
2.43%
Mortgage Type
New Conventional
Estimated Equity
$156,405
Purchase Details
Closed on
Feb 20, 2018
Sold by
Tsotsos Lisa and Donaldson William R
Bought by
Wood Lynn
Home Financials for this Owner
Home Financials are based on the most recent Mortgage that was taken out on this home.
Original Mortgage
$155,200
Interest Rate
4.38%
Mortgage Type
New Conventional
Purchase Details
Closed on
Sep 11, 2014
Sold by
Rubenzer Justin
Bought by
Donaldson William
Purchase Details
Closed on
Dec 17, 2009
Sold by
Wells Fargo Bank
Bought by
Rubenzer Justin David
Purchase Details
Closed on
Mar 11, 2005
Sold by
Waconia T J
Bought by
Pingree Troy
Create a Home Valuation Report for This Property
The Home Valuation Report is an in-depth analysis detailing your home's value as well as a comparison with similar homes in the area
Home Values in the Area
Average Home Value in this Area
Purchase History
| Date | Buyer | Sale Price | Title Company |
|---|---|---|---|
| Anderson Lynn | $3,000 | Ancona Title | |
| Wood Lynn | $194,000 | Trademark Title Services | |
| Donaldson William | $163,500 | Central Land Title Guarantee | |
| Rubenzer Justin David | $115,000 | -- | |
| Pingree Troy | $224,900 | -- |
Source: Public Records
Mortgage History
| Date | Status | Borrower | Loan Amount |
|---|---|---|---|
| Open | Anderson Lynn | $173,250 | |
| Previous Owner | Wood Lynn | $155,200 |
Source: Public Records
Tax History Compared to Growth
Tax History
| Year | Tax Paid | Tax Assessment Tax Assessment Total Assessment is a certain percentage of the fair market value that is determined by local assessors to be the total taxable value of land and additions on the property. | Land | Improvement |
|---|---|---|---|---|
| 2025 | $2,608 | $292,800 | $119,100 | $173,700 |
| 2024 | $2,706 | $281,600 | $114,500 | $167,100 |
| 2023 | $2,638 | $276,000 | $112,300 | $163,700 |
| 2022 | $2,568 | $277,800 | $114,100 | $163,700 |
| 2021 | $2,158 | $234,600 | $90,800 | $143,800 |
| 2020 | $2,104 | $198,000 | $82,500 | $115,500 |
| 2019 | $2,102 | $186,900 | $75,000 | $111,900 |
| 2018 | $2,482 | $0 | $0 | $0 |
| 2016 | $2,094 | $0 | $0 | $0 |
| 2014 | -- | $0 | $0 | $0 |
Source: Public Records
Map
Nearby Homes
- 4943 Bluff Heights Trail SE
- 16367 Timber Crest Dr SE Unit 13
- 16357 Timber Crest Dr SE Unit 11
- 1X Credit River Rd
- 16189 Evanston Ave SE
- 16154 Main Ave SE Unit 313
- 16154 Main Ave SE Unit 125
- 4560 Dakota St SE
- 4680 Tower St SE Unit 109
- 4680 Tower St SE Unit 216
- 5241 Lexington Ct SE
- 16902 Wilderness Trail SE
- 4354 Priorwood St SE
- 5453 Brooks Cir SE
- 16510 Tranquility Ct SE Unit 101
- 17140 Horizon Trail SE
- 5375 Centennial St SE
- 4303 Bass St SE
- 15807 West Ave SE
- TBD Mitchell Cir SE
- 4907 Bluff Heights Trail SE
- 4921 Bluff Heights Trail SE
- 4905 Bluff Heights Trail SE
- 4923 Bluff Heights Trail SE
- 4903 Bluff Heights Trail SE
- 4925 Bluff Heights Trail SE
- 16476 Timber Crest Dr SE
- 16492 Timber Crest Dr SE
- 4927 Bluff Heights Trail SE
- 16474 Timber Crest Dr SE
- 16494 Timber Crest Dr SE
- 4918 Bluff Heights Trail SE
- 16472 Timber Crest Dr SE
- 4908 Bluff Heights Trail SE
- 4920 Bluff Heights Trail SE
- 16496 Timber Crest Dr SE
- 4906 Bluff Heights Trail SE
- 4922 Bluff Heights Trail SE
- 16470 Timber Crest Dr SE
- 4904 Bluff Heights Trail SE