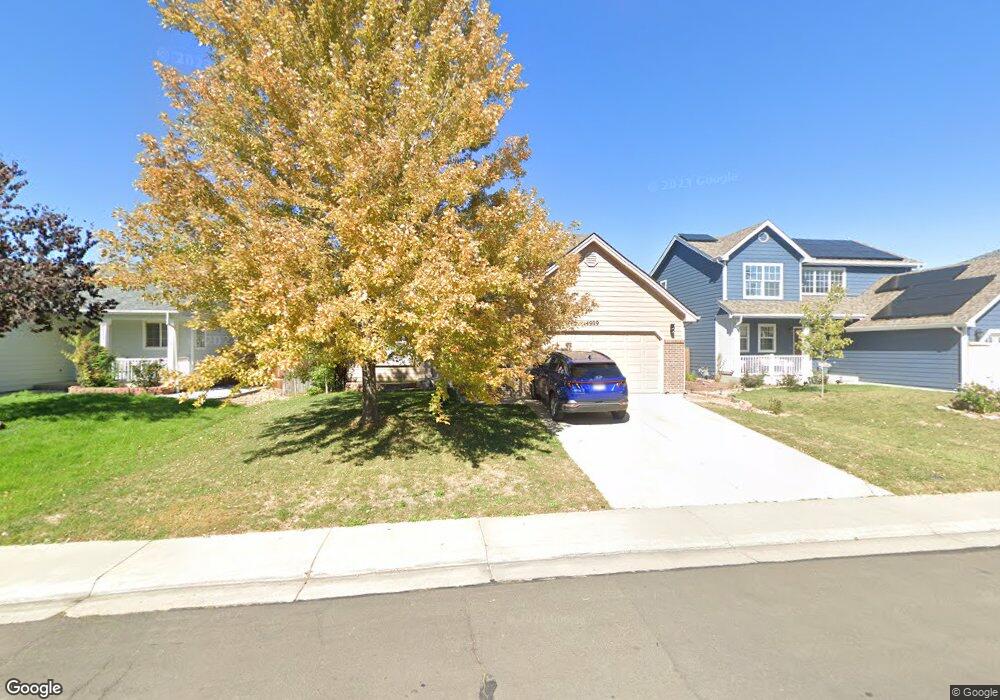
4909 E 119th Ct Thornton, CO 80233
Skylake Ranch NeighborhoodEstimated Value: $498,000 - $545,000
3
Beds
3
Baths
1,787
Sq Ft
$293/Sq Ft
Est. Value
About This Home
This home is located at 4909 E 119th Ct, Thornton, CO 80233 and is currently estimated at $524,194, approximately $293 per square foot. 4909 E 119th Ct is a home located in Adams County with nearby schools including Cherry Drive Elementary School, Shadow Ridge Middle School, and Mountain Range High School.
Ownership History
Date
Name
Owned For
Owner Type
Purchase Details
Closed on
Sep 6, 2016
Sold by
Brooks Matthew L
Bought by
Lafleur Regina
Current Estimated Value
Home Financials for this Owner
Home Financials are based on the most recent Mortgage that was taken out on this home.
Original Mortgage
$308,312
Outstanding Balance
$251,930
Interest Rate
4.5%
Mortgage Type
FHA
Estimated Equity
$272,264
Purchase Details
Closed on
Nov 21, 2012
Sold by
Brooks Zaira M
Bought by
Brooks Matthew L
Purchase Details
Closed on
Nov 28, 2001
Sold by
Fenimore Brent A and Fenimore Melissa A
Bought by
Brooks Matthew L and Brooks Zaira M
Home Financials for this Owner
Home Financials are based on the most recent Mortgage that was taken out on this home.
Original Mortgage
$211,678
Interest Rate
6.57%
Mortgage Type
FHA
Purchase Details
Closed on
Oct 30, 1998
Sold by
Woodcrest Homes Inc
Bought by
Fenimore Brent A and Fenimore Melissa A
Home Financials for this Owner
Home Financials are based on the most recent Mortgage that was taken out on this home.
Original Mortgage
$153,250
Interest Rate
6.57%
Purchase Details
Closed on
Jun 4, 1993
Create a Home Valuation Report for This Property
The Home Valuation Report is an in-depth analysis detailing your home's value as well as a comparison with similar homes in the area
Home Values in the Area
Average Home Value in this Area
Purchase History
| Date | Buyer | Sale Price | Title Company |
|---|---|---|---|
| Lafleur Regina | $314,000 | Land Title Guarantee | |
| Brooks Matthew L | -- | None Available | |
| Brooks Matthew L | $215,000 | Land Title Guarantee Company | |
| Fenimore Brent A | $158,030 | Land Title | |
| -- | -- | -- |
Source: Public Records
Mortgage History
| Date | Status | Borrower | Loan Amount |
|---|---|---|---|
| Open | Lafleur Regina | $308,312 | |
| Previous Owner | Brooks Matthew L | $211,678 | |
| Previous Owner | Fenimore Brent A | $153,250 |
Source: Public Records
Tax History
| Year | Tax Paid | Tax Assessment Tax Assessment Total Assessment is a certain percentage of the fair market value that is determined by local assessors to be the total taxable value of land and additions on the property. | Land | Improvement |
|---|---|---|---|---|
| 2025 | $3,411 | $34,340 | $7,140 | $27,200 |
| 2024 | $3,411 | $31,560 | $6,560 | $25,000 |
| 2023 | $3,376 | $36,670 | $6,430 | $30,240 |
| 2022 | $2,932 | $26,620 | $6,600 | $20,020 |
| 2021 | $3,029 | $26,620 | $6,600 | $20,020 |
| 2020 | $3,107 | $27,850 | $6,790 | $21,060 |
| 2019 | $3,113 | $27,850 | $6,790 | $21,060 |
| 2018 | $2,581 | $22,430 | $6,480 | $15,950 |
| 2017 | $2,347 | $22,430 | $6,480 | $15,950 |
| 2016 | $2,057 | $19,140 | $3,500 | $15,640 |
| 2015 | $2,054 | $19,140 | $3,500 | $15,640 |
| 2014 | -- | $16,600 | $2,950 | $13,650 |
Source: Public Records
Map
Nearby Homes
- 5080 E 120th Place
- 5160 E 120th Place
- 5211 E 119th Ct
- 5243 E 119th Way
- 12099 Forest St
- 12152 Dahlia Dr
- 12129 Forest St
- 12187 Fairfax St
- 11918 Glencoe Dr
- 5005 E 117th Ave
- 4875 E 117th Dr
- 11725 Forest Ct
- 5155 E 117th Dr
- 4402 E 117th Ct
- 12147 Hudson Ct
- 4220 E 119th Place Unit B
- 11981 Bellaire St Unit D
- 12188 Hudson Ct
- 11961 Bellaire St Unit C
- 4160 E 119th Place Unit B
- 4899 E 119th Ct
- 4919 E 119th Ct
- 4889 E 119th Ct
- 4939 E 119th Ct
- 11982 Eudora Dr
- 4879 E 119th Ct
- 4959 E 119th Ct
- 4898 E 119th Ct
- 4888 E 119th Ct
- 11972 Eudora Dr
- 4869 E 119th Ct
- 11983 Elm Dr
- 4950 E 120th Place
- 4979 E 119th Ct
- 4920 E 120th Place
- 4900 E 120th Place
- 11967 Eudora Dr
- 11962 Eudora Dr
- 4990 E 120th Place
- 4878 E 119th Ct
Your Personal Tour Guide
Ask me questions while you tour the home.