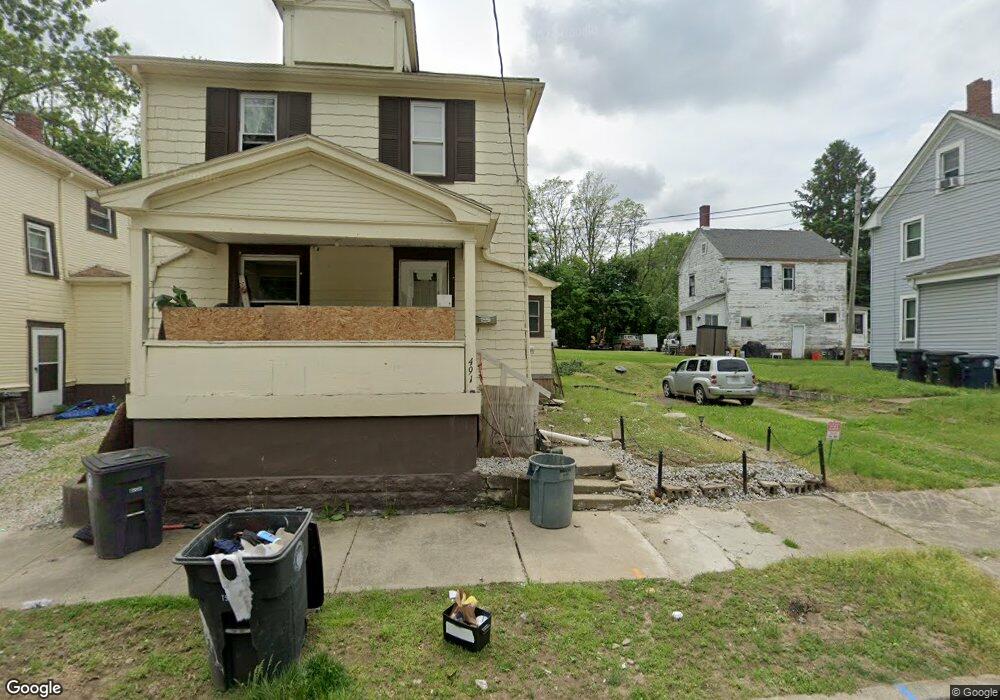
491 Bishop St Akron, OH 44307
Sherbondy Hill NeighborhoodEstimated Value: $65,307 - $105,000
3
Beds
1
Bath
960
Sq Ft
$86/Sq Ft
Est. Value
About This Home
This home is located at 491 Bishop St, Akron, OH 44307 and is currently estimated at $82,827, approximately $86 per square foot. 491 Bishop St is a home located in Summit County with nearby schools including Towpath Trail High School and St. Vincent Elementary School.
Ownership History
Date
Name
Owned For
Owner Type
Purchase Details
Closed on
Apr 1, 2020
Sold by
Mckeen Denise M and Mckeen Harry D
Bought by
Mckeen Harry D and Mckeen Denise M
Current Estimated Value
Purchase Details
Closed on
Mar 17, 2020
Sold by
Mckeen Denise M and Mckeen Harry D
Bought by
Mckeen Harry D and Mckeen Denise M
Purchase Details
Closed on
Aug 2, 1996
Sold by
D M B Enterprises
Bought by
Mckeen Harry and Mckeen Denise
Purchase Details
Closed on
Dec 15, 1994
Sold by
Mesh Effie
Bought by
Dmb Enterprises
Create a Home Valuation Report for This Property
The Home Valuation Report is an in-depth analysis detailing your home's value as well as a comparison with similar homes in the area
Home Values in the Area
Average Home Value in this Area
Purchase History
| Date | Buyer | Sale Price | Title Company |
|---|---|---|---|
| Mckeen Harry D | -- | None Listed On Document | |
| Mckeen Harry D | -- | None Listed On Document | |
| Mckeen Harry | $4,500 | -- | |
| Dmb Enterprises | $5,500 | -- |
Source: Public Records
Tax History Compared to Growth
Tax History
| Year | Tax Paid | Tax Assessment Tax Assessment Total Assessment is a certain percentage of the fair market value that is determined by local assessors to be the total taxable value of land and additions on the property. | Land | Improvement |
|---|---|---|---|---|
| 2025 | $625 | $9,352 | $2,373 | $6,979 |
| 2024 | $625 | $9,352 | $2,373 | $6,979 |
| 2023 | $625 | $9,352 | $2,373 | $6,979 |
| 2022 | $502 | $5,503 | $1,397 | $4,106 |
| 2021 | $502 | $5,503 | $1,397 | $4,106 |
| 2020 | $496 | $5,510 | $1,400 | $4,110 |
| 2019 | $882 | $10,320 | $2,130 | $8,190 |
| 2018 | $814 | $10,320 | $2,130 | $8,190 |
| 2017 | $840 | $10,320 | $2,130 | $8,190 |
| 2016 | $841 | $10,510 | $2,130 | $8,380 |
| 2015 | $840 | $10,510 | $2,130 | $8,380 |
| 2014 | $834 | $10,510 | $2,130 | $8,380 |
| 2013 | $790 | $10,110 | $2,130 | $7,980 |
Source: Public Records
Map
Nearby Homes