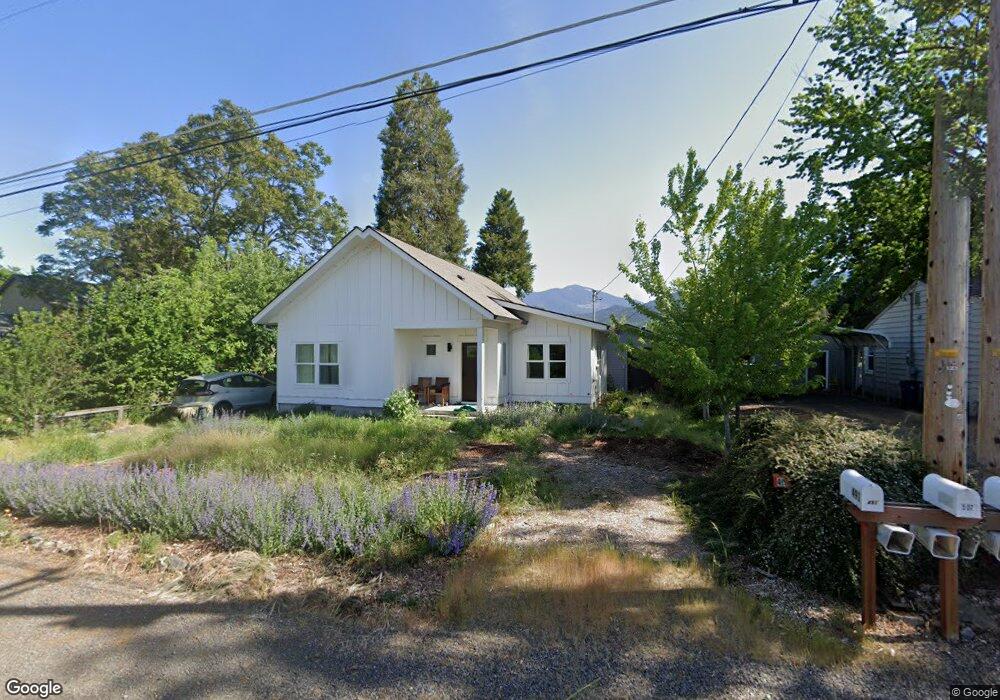
491 Foss Rd Talent, OR 97540
Estimated Value: $351,073 - $371,000
2
Beds
1
Bath
1,001
Sq Ft
$363/Sq Ft
Est. Value
About This Home
This home is located at 491 Foss Rd, Talent, OR 97540 and is currently estimated at $363,691, approximately $363 per square foot. 491 Foss Rd is a home located in Jackson County with nearby schools including Talent Elementary School, Talent Middle School, and Phoenix High School.
Ownership History
Date
Name
Owned For
Owner Type
Purchase Details
Closed on
Oct 13, 2017
Sold by
Buckley Mary A
Current Estimated Value
Home Financials for this Owner
Home Financials are based on the most recent Mortgage that was taken out on this home.
Interest Rate
3.91%
Purchase Details
Closed on
Jul 25, 2005
Sold by
Maple Ryan C and Mcmanamon Maple Sabrah
Bought by
Buckley Mary Ann
Home Financials for this Owner
Home Financials are based on the most recent Mortgage that was taken out on this home.
Original Mortgage
$189,200
Interest Rate
5.46%
Mortgage Type
Fannie Mae Freddie Mac
Purchase Details
Closed on
Sep 12, 2002
Sold by
Wegner Linda C and Estate Of Barbara C Hurley
Bought by
Maple Ryab C and Mcmanamon Maple Sabrah
Home Financials for this Owner
Home Financials are based on the most recent Mortgage that was taken out on this home.
Original Mortgage
$110,580
Interest Rate
6.37%
Create a Home Valuation Report for This Property
The Home Valuation Report is an in-depth analysis detailing your home's value as well as a comparison with similar homes in the area
Home Values in the Area
Average Home Value in this Area
Purchase History
| Date | Buyer | Sale Price | Title Company |
|---|---|---|---|
| -- | -- | -- | |
| Buckley Mary Ann | $236,500 | Lawyers Title Insurance Corp | |
| Maple Ryab C | $114,000 | -- |
Source: Public Records
Mortgage History
| Date | Status | Borrower | Loan Amount |
|---|---|---|---|
| Closed | Record Owner | -- | |
| Previous Owner | Buckley Mary Ann | $189,200 | |
| Previous Owner | Maple Ryab C | $110,580 |
Source: Public Records
Tax History Compared to Growth
Tax History
| Year | Tax Paid | Tax Assessment Tax Assessment Total Assessment is a certain percentage of the fair market value that is determined by local assessors to be the total taxable value of land and additions on the property. | Land | Improvement |
|---|---|---|---|---|
| 2025 | $2,206 | $176,580 | $82,790 | $93,790 |
| 2024 | $2,206 | $171,440 | $71,620 | $99,820 |
| 2023 | $2,136 | $166,450 | $69,530 | $96,920 |
| 2022 | $2,081 | $166,450 | $69,530 | $96,920 |
| 2021 | $2,034 | $161,610 | $67,500 | $94,110 |
| 2020 | $1,969 | $156,910 | $65,530 | $91,380 |
| 2019 | $1,918 | $147,910 | $61,760 | $86,150 |
| 2018 | $1,408 | $108,600 | $59,950 | $48,650 |
| 2017 | $1,320 | $108,600 | $59,950 | $48,650 |
| 2016 | $1,285 | $102,370 | $56,510 | $45,860 |
| 2015 | $1,231 | $102,370 | $56,510 | $45,860 |
| 2014 | $1,182 | $96,500 | $53,260 | $43,240 |
Source: Public Records
Map
Nearby Homes
- 0 Wagner Gap Rd Unit 697062504
- 106 N 1st St
- 539 James St
- 169 Wagner Butte Ave
- 6493 Colver Rd
- 355 Colver Rd Unit 27
- 0 Foss Rd Unit 1500 220195454
- 233 Wintersage Cir
- 0 Tl3300 Suncrest Rd
- 212 Willow Way
- 941 Beeson Ln
- 414 Wintersage
- 0 Suncrest Rd Unit 220198669
- 268 S Pacific Hwy
- 7103 Wagner Creek Rd
- 312 E Rapp Rd
- 100 Oak Valley Dr
- 115 Oak Valley Dr
- 311 S Pacific Hwy
- 300 Oak Valley Dr