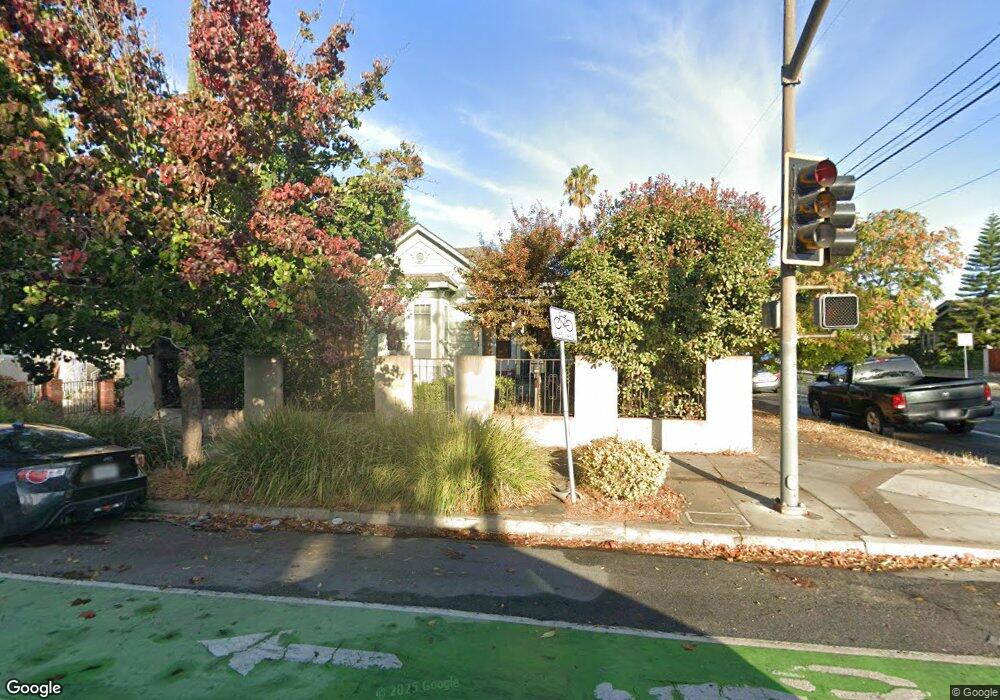
491 Jackson St San Jose, CA 95112
Japantown NeighborhoodEstimated Value: $1,205,000 - $1,274,000
2
Beds
1
Bath
1,673
Sq Ft
$736/Sq Ft
Est. Value
About This Home
This home is located at 491 Jackson St, San Jose, CA 95112 and is currently estimated at $1,231,981, approximately $736 per square foot. 491 Jackson St is a home located in Santa Clara County with nearby schools including Grant Elementary School, Muwekma Ohlone Middle, and San Jose High School.
Ownership History
Date
Name
Owned For
Owner Type
Purchase Details
Closed on
Dec 2, 2009
Sold by
Melendez Carol S and Piccolo Carla C
Bought by
Jackson Norma L and Jackson Jerome
Current Estimated Value
Home Financials for this Owner
Home Financials are based on the most recent Mortgage that was taken out on this home.
Original Mortgage
$386,650
Outstanding Balance
$253,615
Interest Rate
5.01%
Mortgage Type
FHA
Estimated Equity
$978,366
Purchase Details
Closed on
Aug 6, 2009
Sold by
Piccolo Raquel
Bought by
Piccolo Carlo R
Home Financials for this Owner
Home Financials are based on the most recent Mortgage that was taken out on this home.
Original Mortgage
$215,000
Interest Rate
5.3%
Mortgage Type
New Conventional
Purchase Details
Closed on
May 19, 2009
Sold by
Dye Barbara
Bought by
Melendez Carol S and Piccolo Carla C
Purchase Details
Closed on
Mar 4, 2008
Sold by
Piccolo Carlo
Bought by
Piccolo Carlo and Dye Barbara
Create a Home Valuation Report for This Property
The Home Valuation Report is an in-depth analysis detailing your home's value as well as a comparison with similar homes in the area
Home Values in the Area
Average Home Value in this Area
Purchase History
| Date | Buyer | Sale Price | Title Company |
|---|---|---|---|
| Jackson Norma L | $430,000 | Cornerstone Title Company | |
| Piccolo Carlo R | -- | Chicago Title Company | |
| Melendez Carol S | -- | None Available | |
| Piccolo Carlo | -- | None Available |
Source: Public Records
Mortgage History
| Date | Status | Borrower | Loan Amount |
|---|---|---|---|
| Open | Jackson Norma L | $386,650 | |
| Previous Owner | Piccolo Carlo R | $215,000 |
Source: Public Records
Tax History Compared to Growth
Tax History
| Year | Tax Paid | Tax Assessment Tax Assessment Total Assessment is a certain percentage of the fair market value that is determined by local assessors to be the total taxable value of land and additions on the property. | Land | Improvement |
|---|---|---|---|---|
| 2025 | $8,595 | $555,036 | $333,022 | $222,014 |
| 2024 | $8,595 | $544,154 | $326,493 | $217,661 |
| 2023 | $8,385 | $533,486 | $320,092 | $213,394 |
| 2022 | $8,295 | $523,026 | $313,816 | $209,210 |
| 2021 | $8,053 | $512,771 | $307,663 | $205,108 |
| 2020 | $7,784 | $507,514 | $304,509 | $203,005 |
| 2019 | $7,573 | $497,564 | $298,539 | $199,025 |
| 2018 | $7,467 | $487,809 | $292,686 | $195,123 |
| 2017 | $7,386 | $478,246 | $286,948 | $191,298 |
| 2016 | $7,199 | $468,870 | $281,322 | $187,548 |
| 2015 | $7,140 | $461,828 | $277,097 | $184,731 |
| 2014 | $6,236 | $452,783 | $271,670 | $181,113 |
Source: Public Records
Map
Nearby Homes
- 580 Manzana Place Unit 84
- 670 N 14th St
- 705 Cannery Place
- 750 N 12th St
- 748-3 N 10th St
- 775 N 14th St
- 350 E Mission St Unit 211
- 421 N 13th St
- 816 N 13th St
- 1020 N 5th St
- 818 N 13th St
- 800 N 8th St Unit 311
- 800 N 8th St Unit 120
- 805 E Taylor St
- 358 N 7th St
- 520 Madera Ave
- 494 Madera Ave
- 334 N 15th St
- 622 Berryessa Rd
- 863 N 17th St