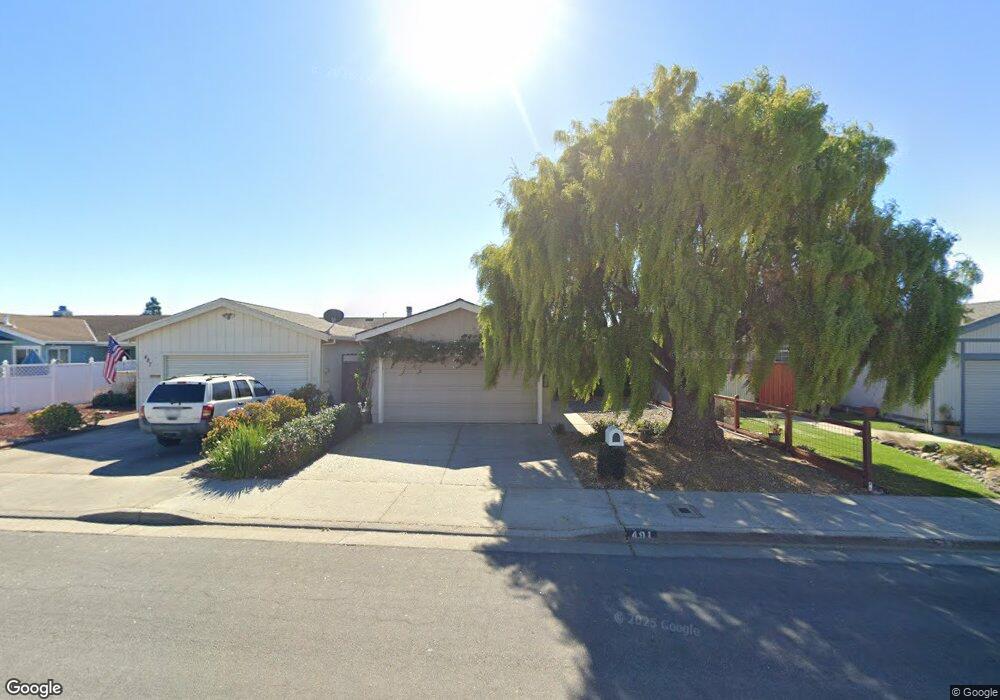
491 Suncrest Way Watsonville, CA 95076
Estimated Value: $556,096 - $621,000
2
Beds
2
Baths
1,070
Sq Ft
$550/Sq Ft
Est. Value
About This Home
This home is located at 491 Suncrest Way, Watsonville, CA 95076 and is currently estimated at $588,524, approximately $550 per square foot. 491 Suncrest Way is a home located in Santa Cruz County with nearby schools including Ann Soldo Elementary School, Lakeview Middle School, and Watsonville High School.
Ownership History
Date
Name
Owned For
Owner Type
Purchase Details
Closed on
Oct 12, 2018
Sold by
Youmans Linda
Bought by
Youmans Linda Jo and The Linda Jo Youmans Living Tr
Current Estimated Value
Purchase Details
Closed on
Feb 20, 2002
Sold by
Goldmann Cammy
Bought by
Youmans Boyd and Youmans Linda
Home Financials for this Owner
Home Financials are based on the most recent Mortgage that was taken out on this home.
Original Mortgage
$70,000
Interest Rate
6.8%
Purchase Details
Closed on
Dec 20, 2001
Sold by
Owens Onez
Bought by
Goldmann Cammy
Purchase Details
Closed on
Dec 19, 2001
Sold by
Goldmann Lanz
Bought by
Goldmann Cammy
Purchase Details
Closed on
Feb 9, 1995
Sold by
Trelease Carol Tucker and Tucker Carol A
Bought by
Owens A J A and Owens Onez
Home Financials for this Owner
Home Financials are based on the most recent Mortgage that was taken out on this home.
Original Mortgage
$77,000
Interest Rate
9.23%
Create a Home Valuation Report for This Property
The Home Valuation Report is an in-depth analysis detailing your home's value as well as a comparison with similar homes in the area
Home Values in the Area
Average Home Value in this Area
Purchase History
| Date | Buyer | Sale Price | Title Company |
|---|---|---|---|
| Youmans Linda Jo | -- | None Available | |
| Youmans Boyd | $170,000 | Santa Cruz Title Company | |
| Goldmann Cammy | -- | Santa Cruz Title Company | |
| Goldmann Cammy | -- | Santa Cruz Title Company | |
| Owens A J A | $112,000 | Santa Cruz Title Company |
Source: Public Records
Mortgage History
| Date | Status | Borrower | Loan Amount |
|---|---|---|---|
| Closed | Youmans Boyd | $70,000 | |
| Previous Owner | Owens A J A | $77,000 |
Source: Public Records
Tax History
| Year | Tax Paid | Tax Assessment Tax Assessment Total Assessment is a certain percentage of the fair market value that is determined by local assessors to be the total taxable value of land and additions on the property. | Land | Improvement |
|---|---|---|---|---|
| 2025 | $4,201 | $364,895 | $221,596 | $143,299 |
| 2023 | $4,136 | $350,725 | $212,991 | $137,734 |
| 2022 | $4,062 | $343,848 | $208,815 | $135,033 |
| 2021 | $3,978 | $337,107 | $204,721 | $132,386 |
| 2020 | $3,921 | $333,649 | $202,621 | $131,028 |
| 2019 | $3,850 | $327,108 | $198,649 | $128,459 |
| 2018 | $3,752 | $320,693 | $194,753 | $125,940 |
| 2017 | $3,718 | $314,406 | $190,935 | $123,471 |
| 2016 | $3,620 | $308,241 | $187,191 | $121,050 |
| 2015 | $3,607 | $303,611 | $184,379 | $119,232 |
| 2014 | $3,315 | $279,552 | $167,731 | $111,821 |
Source: Public Records
Map
Nearby Homes
- 482 Vivienne Dr
- 501 Tuttle Ave
- 525 Cloudview Dr
- 535 Joyce Dr
- 18 Pajaro Vista Ct
- 569 Cedar Dr
- 501 Cedar Dr
- 738 Cynthia Ct
- 624 Delta Way
- 608 Bronte Ave
- 223 Hushbeck Ave
- 718 Roble St
- 563 Argos Cir
- 729 Vista Montana Dr
- 450 Beck St
- 30 Riverside Rd
- 203 Plum Hill Dr
- 708 Hill Ave
- 65 Monte Vista Ave
- 519 Lincoln St
- 487 Suncrest Way
- 495 Suncrest Way
- 483 Suncrest Way
- 499 Suncrest Way
- 490 Vivienne Dr
- 494 Vivienne Dr
- 486 Vivienne Dr
- 479 Suncrest Way
- 498 Vivienne Dr
- 490 Suncrest Way
- 486 Suncrest Way
- 475 Suncrest Way
- 494 Suncrest Way
- 478 Vivienne Dr
- 482 Suncrest Way
- 478 Suncrest Way
- 474 Vivienne Dr
- 471 Suncrest Way
- 474 Suncrest Way
- 501 Suncrest Way
Your Personal Tour Guide
Ask me questions while you tour the home.