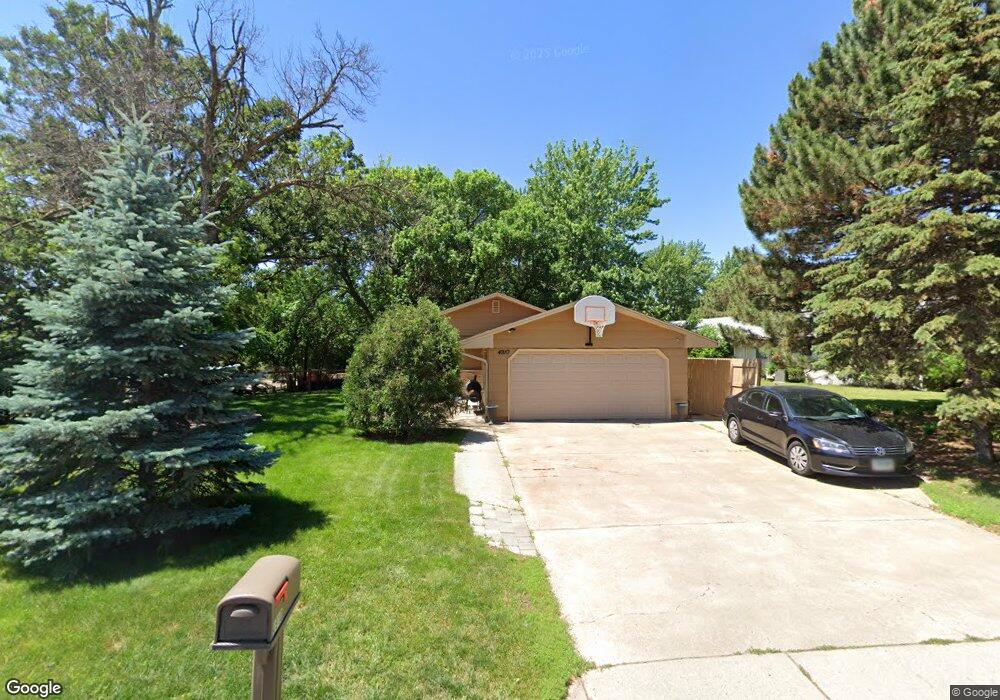
4910 Fillmore St NE Columbia Heights, MN 55421
Estimated Value: $361,000 - $383,000
4
Beds
2
Baths
2,319
Sq Ft
$160/Sq Ft
Est. Value
About This Home
This home is located at 4910 Fillmore St NE, Columbia Heights, MN 55421 and is currently estimated at $371,331, approximately $160 per square foot. 4910 Fillmore St NE is a home located in Anoka County with nearby schools including Highland Elementary School and Immaculate Conception Catholic School.
Ownership History
Date
Name
Owned For
Owner Type
Purchase Details
Closed on
Oct 1, 2021
Sold by
Tucker Aneisha J
Bought by
Tucker Aneisha J and Minor Derrick L
Current Estimated Value
Purchase Details
Closed on
Jun 18, 2021
Sold by
Pfeifer Steven P and Pfeifer Mary Beth
Bought by
Tucker Aneisha J
Home Financials for this Owner
Home Financials are based on the most recent Mortgage that was taken out on this home.
Original Mortgage
$319,113
Outstanding Balance
$289,052
Interest Rate
2.93%
Mortgage Type
FHA
Estimated Equity
$82,279
Purchase Details
Closed on
Apr 29, 2003
Sold by
Gaynor Timothy W and Gaynor Jane L
Bought by
Pfeifer Steven P and Pfeifer Mary Beth
Purchase Details
Closed on
Jul 8, 1997
Sold by
Nimis Naomi and Otte Arthur
Bought by
Kunshier Richard W and Kunshier Loanne
Purchase Details
Closed on
Jun 18, 1997
Sold by
Hart Norma L
Bought by
Gaynor Jane L
Create a Home Valuation Report for This Property
The Home Valuation Report is an in-depth analysis detailing your home's value as well as a comparison with similar homes in the area
Home Values in the Area
Average Home Value in this Area
Purchase History
| Date | Buyer | Sale Price | Title Company |
|---|---|---|---|
| Tucker Aneisha J | -- | None Available | |
| Tucker Aneisha J | $325,000 | Land Title Inc | |
| Pfeifer Steven P | $219,900 | -- | |
| Kunshier Richard W | $50,000 | -- | |
| Gaynor Jane L | $82,700 | -- | |
| Tucker Aneisha Aneisha | $325,000 | -- |
Source: Public Records
Mortgage History
| Date | Status | Borrower | Loan Amount |
|---|---|---|---|
| Open | Tucker Aneisha J | $319,113 | |
| Closed | Tucker Aneisha Aneisha | $319,113 |
Source: Public Records
Tax History Compared to Growth
Tax History
| Year | Tax Paid | Tax Assessment Tax Assessment Total Assessment is a certain percentage of the fair market value that is determined by local assessors to be the total taxable value of land and additions on the property. | Land | Improvement |
|---|---|---|---|---|
| 2025 | $5,418 | $360,900 | $101,100 | $259,800 |
| 2024 | $5,418 | $353,700 | $101,100 | $252,600 |
| 2023 | $3,772 | $320,200 | $94,500 | $225,700 |
| 2022 | $3,856 | $329,700 | $96,700 | $233,000 |
| 2021 | $3,380 | $262,000 | $77,700 | $184,300 |
| 2020 | $3,124 | $242,100 | $74,700 | $167,400 |
| 2019 | $3,440 | $236,700 | $74,700 | $162,000 |
| 2018 | $2,989 | $229,200 | $0 | $0 |
| 2017 | $2,726 | $211,000 | $0 | $0 |
| 2016 | $2,815 | $188,200 | $0 | $0 |
| 2015 | $2,697 | $188,200 | $82,600 | $105,600 |
| 2014 | -- | $159,100 | $67,100 | $92,000 |
Source: Public Records
Map
Nearby Homes
- 1630 49th Ave NE
- 1660 Fairway Dr NE
- 5080 Mulcare Dr
- 1070 Grandview Ct NE Unit 405
- 1070 Grandview Ct NE Unit 101
- 1070 Grandview Ct NE Unit 406
- 4654 Fillmore St NE
- 4625 Taylor St NE
- 4630 Taylor St NE
- 5230 Lincoln St NE
- 719 49th Ave NE
- 4931 Pennine Pass NE
- 2139 Highland Place
- 1448 Windemere Dr NE
- 2209 Forest Dr NE
- 1212 44 1 2 Ave NE
- 4655 Chatham Rd NE
- 4687 Monroe St NE
- 4685 Monroe St NE
- 2221 Highland Place
- 1320 Lincoln Terrace
- 1300 Lincoln Terrace
- 4915 Fillmore St NE
- 4905 Fillmore St NE
- 1260 Lincoln Terrace
- 4925 Fillmore St NE
- 1309 Lincoln Terrace
- 1275 Lincoln Terrace
- 1240 Lincoln Terrace
- 1401 Lincoln Terrace
- 1400 Lincoln Terrace
- 1255 Lincoln Terrace
- 4950 Fillmore St NE
- 1420 Molan Terrace
- 1221 49th Ave NE
- 4945 Fillmore St NE
- 1235 Lincoln Terrace
- 4960 Fillmore St NE
- 1405 Lincoln Terrace
- 1440 Molan Terrace