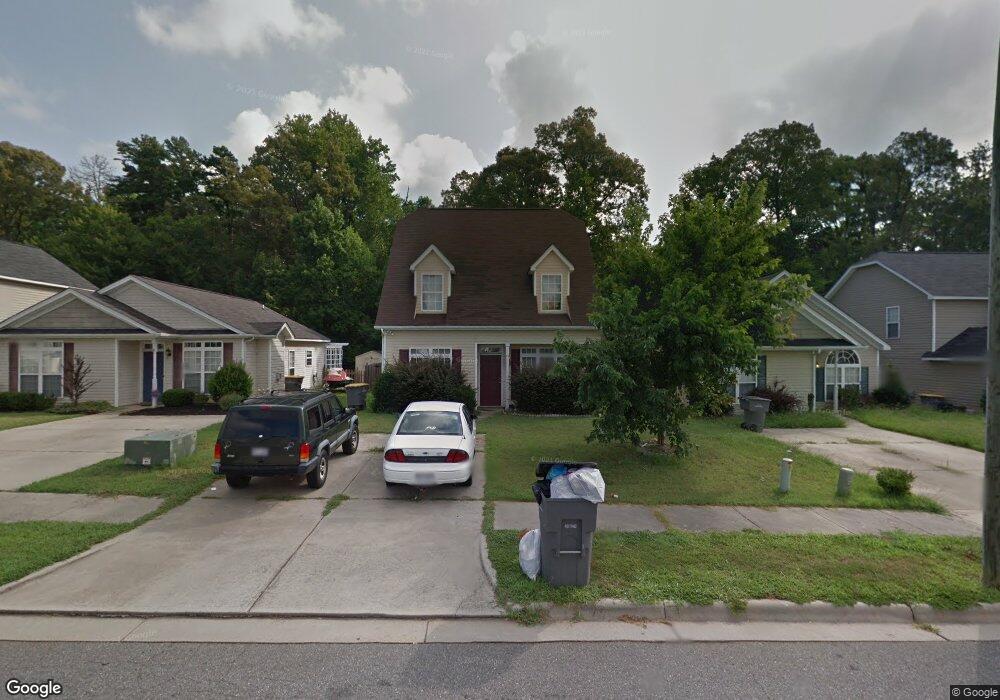
4910 Hawfield St Kannapolis, NC 28083
Estimated Value: $261,000 - $304,000
3
Beds
3
Baths
1,550
Sq Ft
$182/Sq Ft
Est. Value
About This Home
This home is located at 4910 Hawfield St, Kannapolis, NC 28083 and is currently estimated at $282,048, approximately $181 per square foot. 4910 Hawfield St is a home located in Cabarrus County with nearby schools including Royal Oaks Elementary School, Concord Middle School, and Concord High School.
Ownership History
Date
Name
Owned For
Owner Type
Purchase Details
Closed on
Dec 4, 2013
Sold by
Hsbc Mortgage Services Inc
Bought by
Howard Rashan
Current Estimated Value
Home Financials for this Owner
Home Financials are based on the most recent Mortgage that was taken out on this home.
Original Mortgage
$82,600
Outstanding Balance
$61,835
Interest Rate
4.25%
Mortgage Type
Adjustable Rate Mortgage/ARM
Estimated Equity
$220,213
Purchase Details
Closed on
Sep 10, 2013
Sold by
Mcmillan Delaine
Bought by
Hsbc Mortgage Services Inc
Purchase Details
Closed on
Sep 29, 2003
Sold by
Persis Nova Construction Inc
Bought by
Mcmillan Delaine
Home Financials for this Owner
Home Financials are based on the most recent Mortgage that was taken out on this home.
Original Mortgage
$12,014
Interest Rate
6.28%
Mortgage Type
FHA
Purchase Details
Closed on
Jun 30, 2003
Sold by
Whitaker Donald E
Bought by
Persis Nova Construction Inc
Create a Home Valuation Report for This Property
The Home Valuation Report is an in-depth analysis detailing your home's value as well as a comparison with similar homes in the area
Home Values in the Area
Average Home Value in this Area
Purchase History
| Date | Buyer | Sale Price | Title Company |
|---|---|---|---|
| Howard Rashan | $81,000 | None Available | |
| Hsbc Mortgage Services Inc | $77,956 | None Available | |
| Mcmillan Delaine | $113,000 | -- | |
| Persis Nova Construction Inc | $56,000 | -- |
Source: Public Records
Mortgage History
| Date | Status | Borrower | Loan Amount |
|---|---|---|---|
| Open | Howard Rashan | $82,600 | |
| Previous Owner | Mcmillan Delaine | $12,014 |
Source: Public Records
Tax History
| Year | Tax Paid | Tax Assessment Tax Assessment Total Assessment is a certain percentage of the fair market value that is determined by local assessors to be the total taxable value of land and additions on the property. | Land | Improvement |
|---|---|---|---|---|
| 2025 | $3,011 | $265,140 | $60,000 | $205,140 |
| 2024 | $3,011 | $265,140 | $60,000 | $205,140 |
| 2023 | $1,977 | $144,310 | $32,000 | $112,310 |
| 2022 | $1,977 | $144,310 | $32,000 | $112,310 |
| 2021 | $1,977 | $144,310 | $32,000 | $112,310 |
| 2020 | $1,977 | $144,310 | $32,000 | $112,310 |
| 2019 | $1,421 | $103,740 | $18,000 | $85,740 |
| 2018 | $1,400 | $103,740 | $18,000 | $85,740 |
| 2017 | $1,380 | $103,740 | $18,000 | $85,740 |
| 2016 | $1,380 | $103,370 | $20,000 | $83,370 |
| 2015 | $1,302 | $103,370 | $20,000 | $83,370 |
| 2014 | $1,302 | $103,370 | $20,000 | $83,370 |
Source: Public Records
Map
Nearby Homes
- 3241 Ian Patrick Ave
- 3397 Camp Julia Rd
- 3246 Camp Julia Rd
- 5027 Old Salisbury Concord Rd
- 2707 Ireton Place
- 2882 Centergrove Rd
- 2640 Centergrove Rd
- 915 Harbour View Cove NE
- 2495 Centergrove Rd
- 3830 Old Salisbury Concord Rd
- 361 China Grove Rd
- 2124 Clear Brook Dr
- 453 China Grove Rd
- 2020 Quill Ct
- 5295 Sapp Rd
- 2420 Lane St
- 304 Athens Hills Place
- 1838 Summit Ridge Ln
- 2551 Glenwood St
- 320 Tree Limb Ln
- 4898 Hawfield St
- 4916 Hawfield St
- 4894 Hawfield St
- 4922 Hawfield St
- 4928 Hawfield St
- 4890 Hawfield St
- 4917 Hawfield St
- 3254 Penny Earley Ln
- 4923 Hawfield St
- 4934 Hawfield St
- 4886 Hawfield St
- 4929 Hawfield St
- 3250 Penny Earley Ln
- 4882 Hawfield St
- 4935 Hawfield St
- 3249 Elliot Jacob Ave
- 3246 Penny Earley Ln
- 3247 Penny Earley Ln
- 4941 Hawfield St
- 4878 Hawfield St
Your Personal Tour Guide
Ask me questions while you tour the home.