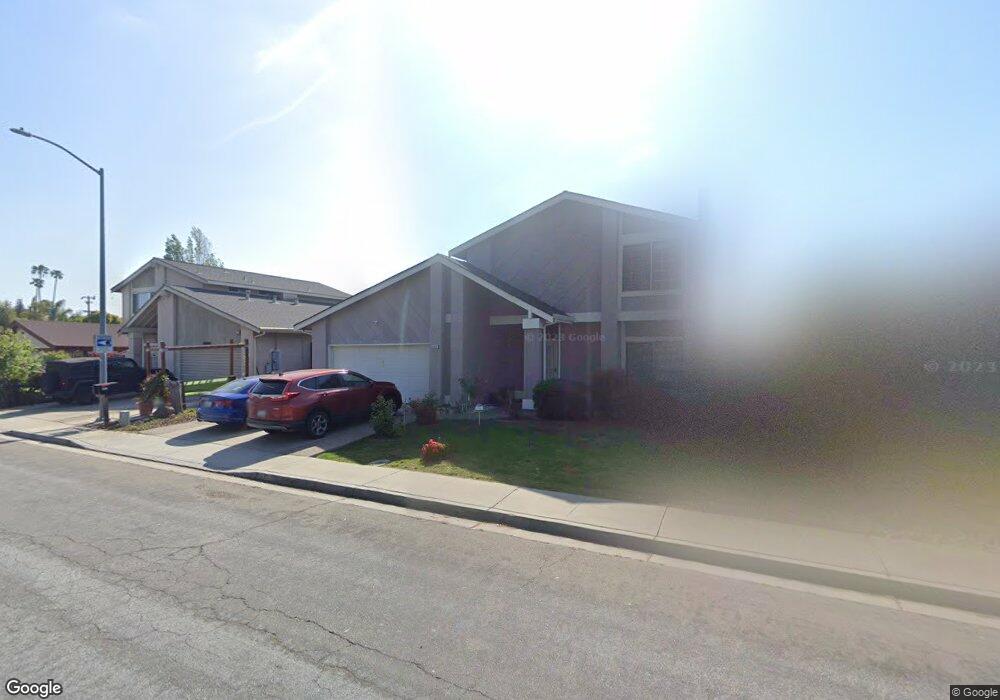
4910 Seneca Park Loop Fremont, CA 94538
Blacow NeighborhoodEstimated Value: $1,825,000 - $1,978,000
4
Beds
3
Baths
2,097
Sq Ft
$899/Sq Ft
Est. Value
About This Home
This home is located at 4910 Seneca Park Loop, Fremont, CA 94538 and is currently estimated at $1,886,134, approximately $899 per square foot. 4910 Seneca Park Loop is a home located in Alameda County with nearby schools including Steven Millard Elementary, G.M. Walters Middle School, and John F. Kennedy High School.
Ownership History
Date
Name
Owned For
Owner Type
Purchase Details
Closed on
Oct 4, 2019
Sold by
Lee Shun Y and Lee Lily Q
Bought by
Kalathooru Venkatesh and Anusha Buchireddygari
Current Estimated Value
Home Financials for this Owner
Home Financials are based on the most recent Mortgage that was taken out on this home.
Original Mortgage
$1,000,000
Outstanding Balance
$878,721
Interest Rate
3.65%
Mortgage Type
New Conventional
Estimated Equity
$1,007,413
Purchase Details
Closed on
May 19, 2006
Sold by
Garzota Aurelia P and Garzota Calixto B
Bought by
Lee Shun Y and Lee Lily Q
Purchase Details
Closed on
Dec 16, 1993
Sold by
Wenceslao Pacifico E and Wenceslao Florina
Bought by
Garzota Aurelia P and Garzota Calixto B
Home Financials for this Owner
Home Financials are based on the most recent Mortgage that was taken out on this home.
Original Mortgage
$203,150
Interest Rate
7.2%
Create a Home Valuation Report for This Property
The Home Valuation Report is an in-depth analysis detailing your home's value as well as a comparison with similar homes in the area
Home Values in the Area
Average Home Value in this Area
Purchase History
| Date | Buyer | Sale Price | Title Company |
|---|---|---|---|
| Kalathooru Venkatesh | $1,280,000 | Chicago Title Company | |
| Lee Shun Y | $630,000 | First American Title Co | |
| Garzota Aurelia P | $102,000 | Commonwealth Land Title Ins |
Source: Public Records
Mortgage History
| Date | Status | Borrower | Loan Amount |
|---|---|---|---|
| Open | Kalathooru Venkatesh | $1,000,000 | |
| Previous Owner | Garzota Aurelia P | $203,150 |
Source: Public Records
Tax History
| Year | Tax Paid | Tax Assessment Tax Assessment Total Assessment is a certain percentage of the fair market value that is determined by local assessors to be the total taxable value of land and additions on the property. | Land | Improvement |
|---|---|---|---|---|
| 2025 | $16,372 | $1,399,845 | $492,133 | $907,712 |
| 2024 | $16,372 | $1,372,402 | $482,485 | $889,917 |
| 2023 | $15,950 | $1,345,497 | $473,026 | $872,471 |
| 2022 | $15,766 | $1,319,116 | $463,752 | $855,364 |
| 2021 | $15,375 | $1,293,260 | $454,662 | $838,598 |
| 2020 | $15,489 | $1,280,000 | $450,000 | $830,000 |
| 2019 | $9,657 | $771,743 | $232,748 | $538,995 |
| 2018 | $9,470 | $756,617 | $228,186 | $528,431 |
| 2017 | $9,234 | $741,786 | $223,713 | $518,073 |
| 2016 | $9,078 | $727,246 | $219,328 | $507,918 |
| 2015 | $8,959 | $716,328 | $216,035 | $500,293 |
| 2014 | $8,807 | $702,298 | $211,804 | $490,494 |
Source: Public Records
Map
Nearby Homes
- 5083 Yellowstone Park Dr
- 42688 Saratoga Park St
- 43163 Grimmer Terrace
- 4986 Everglades Park Dr
- 43387 Castle Park Ct
- 5671 Coral Ct
- 4759 Valpey Park Ave
- 34 Eagle Green
- 4423 Bush Cir
- 88 Delta Green
- 4537 Capewood Terrace
- 4533 Capewood Terrace
- 79 Delta Green
- 5460 Curtis St
- 4309 Bora Ave
- 5217 Farina Ln
- 257 Manitoba Green
- 4070 Drew Terrace
- 294 Winnipeg Terrace
- 266 Winnipeg Terrace
- 4916 Seneca Park Loop
- 4904 Seneca Park Loop
- 4898 Seneca Park Loop
- 4922 Seneca Park Loop
- 42999 Isle Royal St
- 4928 Seneca Park Loop
- 4934 Seneca Park Loop
- 42975 Isle Royal St
- 4890 Seneca Park Ave
- 4940 Seneca Park Loop
- 5013 Banff Park Ct
- 4898 Regents Park Ln
- 42959 Isle Royal St
- 4889 Seneca Park Ave
- 5002 Banff Park Ct
- 4946 Seneca Park Loop
- 5025 Banff Park Ct
- 4882 Seneca Park Ave
- 4894 Regents Park Ln
- 4952 Seneca Park Loop
Your Personal Tour Guide
Ask me questions while you tour the home.