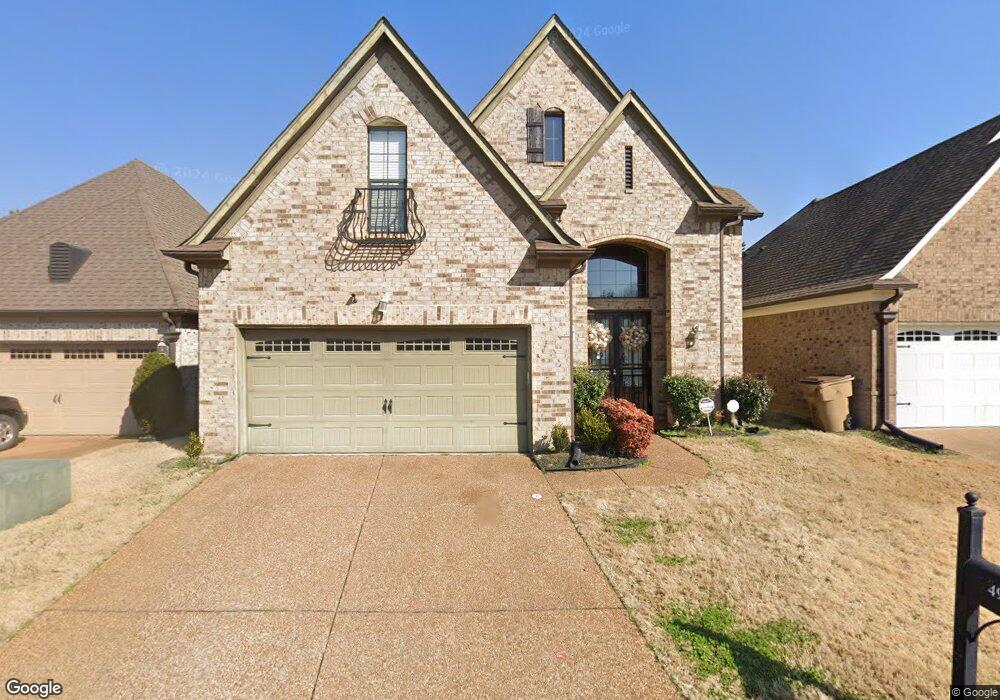
4910 Stirrup Dr Memphis, TN 38125
Southern Shelby County NeighborhoodEstimated Value: $338,000 - $375,000
4
Beds
3
Baths
3,274
Sq Ft
$109/Sq Ft
Est. Value
About This Home
This home is located at 4910 Stirrup Dr, Memphis, TN 38125 and is currently estimated at $357,970, approximately $109 per square foot. 4910 Stirrup Dr is a home located in Shelby County with nearby schools including Southwind Elementary School, Highland Oaks Middle School, and Southwind High School.
Ownership History
Date
Name
Owned For
Owner Type
Purchase Details
Closed on
Jan 12, 2012
Sold by
Griffin William N
Bought by
Fipps Maria E and Williams Dennis Morris
Current Estimated Value
Purchase Details
Closed on
Dec 28, 2009
Sold by
Leader Five Star Homes Llc
Bought by
Fipps Maria E
Home Financials for this Owner
Home Financials are based on the most recent Mortgage that was taken out on this home.
Original Mortgage
$216,275
Interest Rate
4.82%
Mortgage Type
New Conventional
Purchase Details
Closed on
Aug 14, 2009
Sold by
Crossroads Ventures Llc
Bought by
Leader Five Star Homes Llc
Home Financials for this Owner
Home Financials are based on the most recent Mortgage that was taken out on this home.
Original Mortgage
$595,920
Interest Rate
5.26%
Mortgage Type
Future Advance Clause Open End Mortgage
Purchase Details
Closed on
May 28, 2008
Sold by
Regions Bank
Bought by
Crossroads Ventures Llc
Purchase Details
Closed on
Dec 12, 2007
Sold by
Mark Matthews Development Llc
Bought by
Regions Bank
Create a Home Valuation Report for This Property
The Home Valuation Report is an in-depth analysis detailing your home's value as well as a comparison with similar homes in the area
Home Values in the Area
Average Home Value in this Area
Purchase History
| Date | Buyer | Sale Price | Title Company |
|---|---|---|---|
| Fipps Maria E | -- | None Available | |
| Griffin William N | -- | None Available | |
| Fipps Maria E | $211,950 | None Available | |
| Leader Five Star Homes Llc | $82,500 | None Available | |
| Crossroads Ventures Llc | $1,162,000 | Edco Title & Closing Service | |
| Regions Bank | $1,402,150 | None Available |
Source: Public Records
Mortgage History
| Date | Status | Borrower | Loan Amount |
|---|---|---|---|
| Previous Owner | Fipps Maria E | $216,275 | |
| Previous Owner | Leader Five Star Homes Llc | $595,920 |
Source: Public Records
Tax History
| Year | Tax Paid | Tax Assessment Tax Assessment Total Assessment is a certain percentage of the fair market value that is determined by local assessors to be the total taxable value of land and additions on the property. | Land | Improvement |
|---|---|---|---|---|
| 2025 | $2,330 | $99,600 | $14,750 | $84,850 |
| 2024 | $2,330 | $68,725 | $8,500 | $60,225 |
| 2023 | $2,330 | $68,725 | $8,500 | $60,225 |
| 2022 | $2,330 | $68,725 | $8,500 | $60,225 |
| 2021 | $2,371 | $68,725 | $8,500 | $60,225 |
| 2020 | $2,391 | $59,025 | $8,500 | $50,525 |
| 2019 | $2,391 | $59,025 | $8,500 | $50,525 |
| 2018 | $2,391 | $59,025 | $8,500 | $50,525 |
| 2017 | $2,426 | $59,025 | $8,500 | $50,525 |
| 2016 | $1,941 | $44,425 | $0 | $0 |
| 2014 | $1,941 | $44,425 | $0 | $0 |
Source: Public Records
Map
Nearby Homes
- 4883 Saddlehorn Cove
- 7848 Pinefrost Ln
- 4908 Top Notch Loop
- 7763 Shadowcrest Rd
- 5167 Silver Peak Ln
- 7709 Canyon Ridge Cove
- 7608 Comstock Cove
- 4655 Meadow Cliff Dr
- 7703 Driscoll St
- 5094 Denton Cove N
- 5167 Grand Pines Dr
- 4502 Sweet Whisper Cove
- 7518 Harvest Park Cove
- 8275 Cypress Bend Cove
- 7743 Freehold Dr
- 4419 Berkley Woods Dr
- 4580 Wood Fox Cove
- 7661 Brookbriar Cove
- 5369 Brookwater Cove S
- 7656 Glen Laurel Way
- 4906 Stirrup Dr
- 4914 Stirrup Dr
- 4902 Stirrup Dr
- 4898 Stirrup Dr
- 7977 River Mist Dr
- 4924 Stirrup Dr
- 4894 Stirrup Dr
- 7972 Parkmont Dr
- 7973 River Mist Dr
- 4890 Stirrup Dr
- 4886 Stirrup Dr
- 7969 River Mist Dr
- 7962 Parkmont Dr
- 7965 River Mist Dr
- 7974 River Mist Dr
- 7966 River Mist Dr
- 7966 Parkmont Dr
- 7962 River Mist Dr
- 7958 Parkmont Dr
- 4882 Stirrup Dr
Your Personal Tour Guide
Ask me questions while you tour the home.