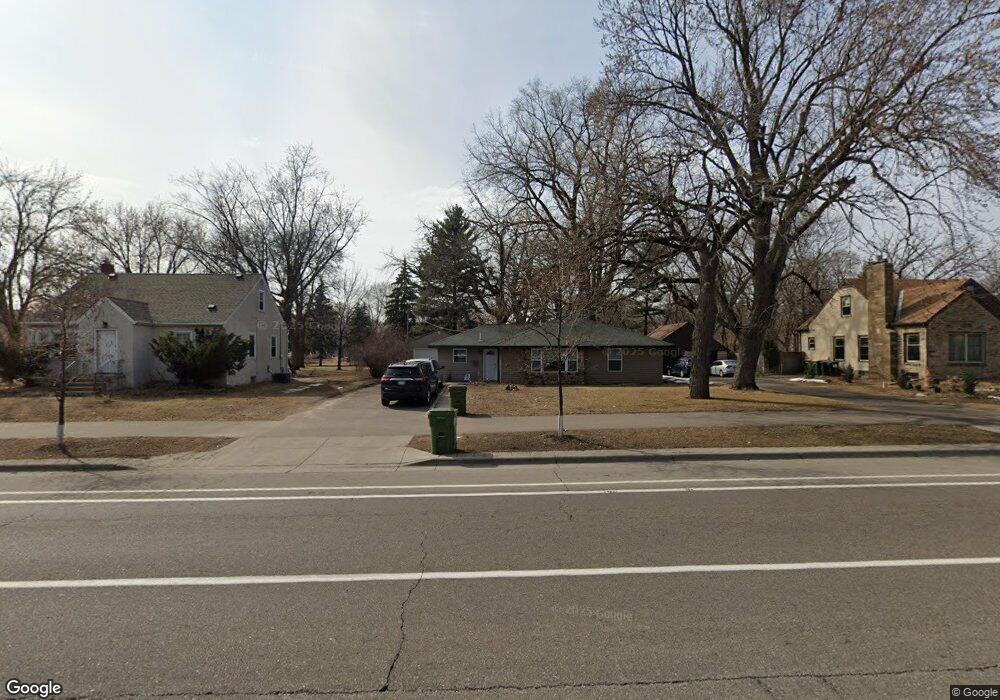
4911 Brooklyn Blvd Minneapolis, MN 55429
Estimated Value: $320,427 - $338,000
3
Beds
2
Baths
1,452
Sq Ft
$226/Sq Ft
Est. Value
About This Home
This home is located at 4911 Brooklyn Blvd, Minneapolis, MN 55429 and is currently estimated at $328,107, approximately $225 per square foot. 4911 Brooklyn Blvd is a home located in Hennepin County with nearby schools including Lakeview Elementary School, Robbinsdale Middle School, and Robbinsdale Cooper Senior High School.
Ownership History
Date
Name
Owned For
Owner Type
Purchase Details
Closed on
May 19, 2020
Sold by
Bryskin Eugene and Vizelman Yevgenia
Bought by
Ortiz Miguel Hernandez and Horopeza Marible Atilano
Current Estimated Value
Home Financials for this Owner
Home Financials are based on the most recent Mortgage that was taken out on this home.
Original Mortgage
$252,200
Outstanding Balance
$130,163
Interest Rate
3.3%
Mortgage Type
Stand Alone Second
Estimated Equity
$197,944
Purchase Details
Closed on
Mar 16, 2017
Sold by
Loan Depot Com Llc
Bought by
Bryskin Eugene
Purchase Details
Closed on
Sep 20, 2016
Sold by
Federal Home Loan Mortgage Corporation
Bought by
Loandepot Com Llc
Purchase Details
Closed on
Jun 24, 2016
Sold by
Vanhavermaet Brian R
Bought by
Loandepot Com Llc
Create a Home Valuation Report for This Property
The Home Valuation Report is an in-depth analysis detailing your home's value as well as a comparison with similar homes in the area
Home Values in the Area
Average Home Value in this Area
Purchase History
| Date | Buyer | Sale Price | Title Company |
|---|---|---|---|
| Ortiz Miguel Hernandez | $260,000 | Trademark Title Services Inc | |
| Bryskin Eugene | $109,400 | Titlesmart Inc | |
| Loandepot Com Llc | -- | Attorney | |
| Loandepot Com Llc | $132,600 | Attorney |
Source: Public Records
Mortgage History
| Date | Status | Borrower | Loan Amount |
|---|---|---|---|
| Open | Ortiz Miguel Hernandez | $252,200 | |
| Closed | Ortiz Miguel Hernandez | $252,200 |
Source: Public Records
Tax History Compared to Growth
Tax History
| Year | Tax Paid | Tax Assessment Tax Assessment Total Assessment is a certain percentage of the fair market value that is determined by local assessors to be the total taxable value of land and additions on the property. | Land | Improvement |
|---|---|---|---|---|
| 2024 | $4,519 | $310,500 | $91,000 | $219,500 |
| 2023 | $5,495 | $313,800 | $93,000 | $220,800 |
| 2022 | $3,740 | $297,000 | $85,000 | $212,000 |
| 2021 | $3,793 | $246,000 | $62,000 | $184,000 |
| 2020 | $3,786 | $233,000 | $52,000 | $181,000 |
| 2019 | $3,154 | $226,000 | $52,000 | $174,000 |
| 2018 | $2,530 | $176,000 | $52,000 | $124,000 |
| 2017 | $1,928 | $128,000 | $35,000 | $93,000 |
| 2016 | $1,957 | $124,900 | $38,000 | $86,900 |
| 2015 | $1,686 | $112,100 | $34,100 | $78,000 |
| 2014 | -- | $104,600 | $32,600 | $72,000 |
Source: Public Records
Map
Nearby Homes
- 4730 Xerxes Ave N
- 5041 Upton Ave N
- 5104 Vincent Ave N
- 3420 46th Ave N
- 4535 Vincent Ave N
- 4635 Thomas Ave N
- 5122 Sheridan Ave N
- 5030 Russell Ave N
- 4634 Thomas Ave N
- 5244 Vincent Ave N
- 4921 Penn Ave N
- 4650 Russell Ave N
- 5136 Queen Ave N
- 4601 Russell Ave N
- 5213 Ewing Ave N
- 5218 France Ave N
- 4914 Oliver Ave N
- 4418 Chowen Ave N
- 5253 Queen Ave N
- 5252 Queen Ave N
- 4925 Brooklyn Blvd
- 4903 Brooklyn Blvd
- 4929 Brooklyn Blvd
- 3112 49th Ave N
- 4933 Brooklyn Blvd
- 4912 Zenith Ave N
- 4920 Zenith Ave N
- 4906 Xerxes Ave N
- 4910 Xerxes Ave N
- 4904 Xerxes Ave N
- 4900 Zenith Ave N
- 4906 Zenith Ave N
- 4937 Brooklyn Blvd
- 4914 Xerxes Ave N
- 4928 Zenith Ave N
- 4918 Xerxes Ave N
- 3129 49th Ave N
- 4938 Zenith Ave N
- 4922 Xerxes Ave N
- 3135 49th Ave N