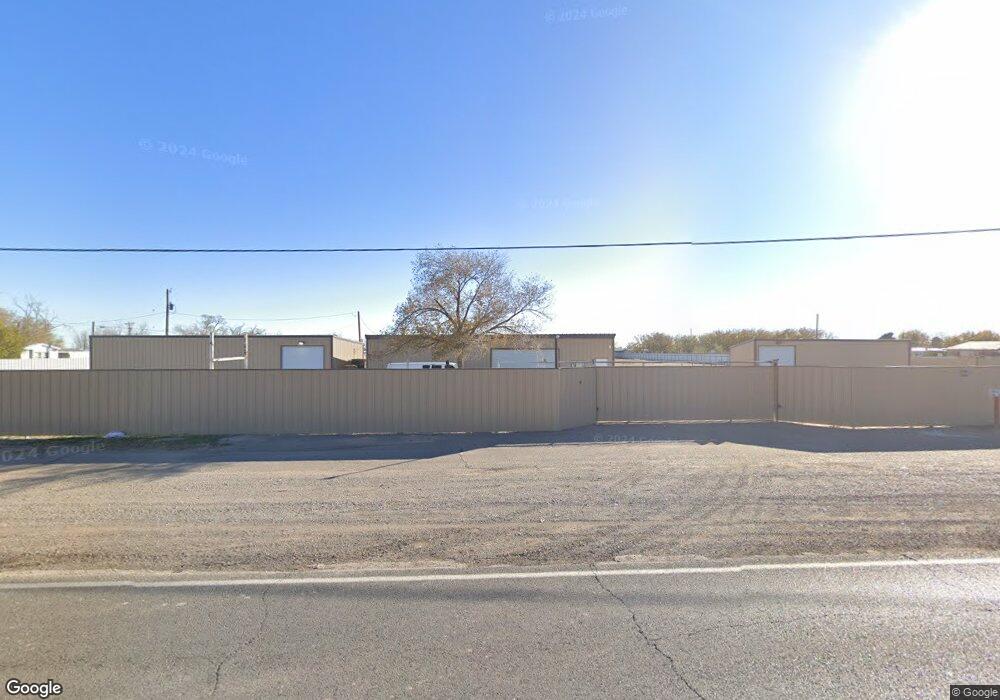
4911 S Main St Roswell, NM 88203
Estimated Value: $290,000
--
Bed
--
Bath
4,051
Sq Ft
$72/Sq Ft
Est. Value
About This Home
This home is located at 4911 S Main St, Roswell, NM 88203 and is currently estimated at $290,000, approximately $71 per square foot. 4911 S Main St is a home located in Chaves County with nearby schools including East Grand Plains Elementary School, Mountain View Middle School, and Early College High School.
Ownership History
Date
Name
Owned For
Owner Type
Purchase Details
Closed on
Apr 7, 2021
Sold by
Armenta Alfredo and Armenta Gricelda
Bought by
Echeverry Neiva and Reyes Jose
Current Estimated Value
Purchase Details
Closed on
Apr 5, 2021
Sold by
Haro Juan
Bought by
Armenta Alfredo and Armenta Gricelda
Purchase Details
Closed on
Sep 27, 2016
Sold by
R E M Co Inc
Bought by
Dickman Paul M and Dickman Darleen A
Purchase Details
Closed on
Apr 26, 2013
Sold by
Bank Of America N A
Bought by
Gass Kurt
Purchase Details
Closed on
Apr 18, 2013
Sold by
Gass Kurt and Gass Janice L
Bought by
Gass Kurt and Gass Janice L
Purchase Details
Closed on
Aug 1, 2008
Sold by
Dearing Jeremiah and Dearing Jeneva
Bought by
Haro Juan
Purchase Details
Closed on
Feb 6, 2006
Sold by
Wood Ronnie F and Wood Chari C
Bought by
Hay Wesley and Hay Hazel
Purchase Details
Closed on
Sep 23, 2005
Sold by
Dearing Rodney Anson
Bought by
Dearing Jeremiah and Dearing Jeneva
Create a Home Valuation Report for This Property
The Home Valuation Report is an in-depth analysis detailing your home's value as well as a comparison with similar homes in the area
Home Values in the Area
Average Home Value in this Area
Purchase History
| Date | Buyer | Sale Price | Title Company |
|---|---|---|---|
| Echeverry Neiva | -- | Landmark Title Company | |
| Armenta Alfredo | -- | Landmark Title Company | |
| Dickman Paul M | -- | None Available | |
| Gass Kurt | -- | First American Title | |
| Gass Kurt | -- | First Ameican Title | |
| Haro Juan | -- | None Available | |
| Hay Wesley | -- | None Available | |
| Dearing Jeremiah | -- | None Available |
Source: Public Records
Tax History Compared to Growth
Tax History
| Year | Tax Paid | Tax Assessment Tax Assessment Total Assessment is a certain percentage of the fair market value that is determined by local assessors to be the total taxable value of land and additions on the property. | Land | Improvement |
|---|---|---|---|---|
| 2025 | $1,317 | $49,458 | $23,362 | $26,096 |
| 2024 | $1,317 | $50,532 | $23,362 | $27,170 |
| 2023 | $1,274 | $46,596 | $23,362 | $23,234 |
| 2022 | $1,271 | $46,487 | $23,362 | $23,125 |
| 2021 | $717 | $26,197 | $23,362 | $2,835 |
| 2020 | $716 | $26,170 | $23,362 | $2,808 |
| 2019 | $719 | $26,304 | $23,362 | $2,942 |
| 2018 | $719 | $26,472 | $23,362 | $3,110 |
| 2017 | $712 | $26,766 | $23,362 | $3,404 |
| 2016 | $699 | $27,108 | $23,362 | $3,746 |
| 2015 | $780 | $27,467 | $23,362 | $4,105 |
| 2014 | $756 | $13,311 | $8,761 | $4,550 |
Source: Public Records
Map
Nearby Homes
- 5000 S Main St
- 3801 S Main St
- 00 Hamill Rd St
- 500 W Brasher #78 Rd
- 00 Blanco Rosa Ln
- Buena Vida Block: 35 Lot: 1 Bk: 400
- 5905 S Main St
- 8703 S Main St
- 2698 S Main St
- 12 Murphy Place
- 5901 S Main St
- 5831 S Main St
- 2103 S Main St
- 100 Blk Jaffa St
- 702 Hickory Dr
- 22 I St
- 2904 S Lea Ave
- 2800 W Onyx St
- 2710 W Onyx St
- 2706 W Onyx St
- 4907 S Main St
- 5001 S Main St
- 4908 S Main St
- 4914 S Main St
- 4906 S Main St
- 102 E Mountain View Rd
- 106 E Mountain View Rd
- 5004 S Main St
- 115 E Burkette Rd
- 5006 S Main St
- 200 W Mountain View Rd
- 4909 S Pennsylvania Ave
- 5007 S Pennsylvania Ave
- 202 W Mountain View Rd
- 202 W Mountain View Rd
- 4911 Smith Ave
- 4900 Smith Ave
- 4911 S Pennsylvania Ave
- 4915 Smith Ave
- 4919 Smith Ave