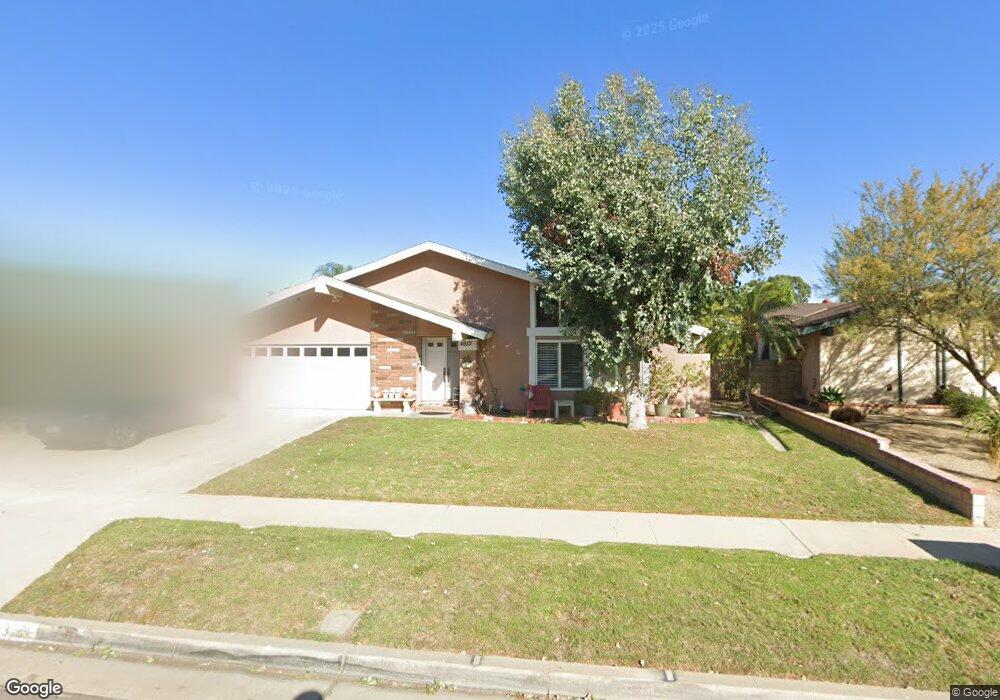
4913 E Florence Cir Anaheim, CA 92807
Anaheim Hills NeighborhoodEstimated Value: $927,000 - $980,000
4
Beds
3
Baths
1,506
Sq Ft
$633/Sq Ft
Est. Value
About This Home
This home is located at 4913 E Florence Cir, Anaheim, CA 92807 and is currently estimated at $953,830, approximately $633 per square foot. 4913 E Florence Cir is a home located in Orange County with nearby schools including Crescent Elementary School, Canyon High School, and El Rancho Charter.
Ownership History
Date
Name
Owned For
Owner Type
Purchase Details
Closed on
Jul 3, 2012
Sold by
Redmond Fred
Bought by
Redmond Fred and The Fred Redmond Trust
Current Estimated Value
Purchase Details
Closed on
May 1, 2012
Sold by
Redmond Fred
Bought by
Redmond Fred
Purchase Details
Closed on
Mar 25, 2011
Sold by
Redmond Fred H
Bought by
Redmond Fred and Fred Redmond Trust
Purchase Details
Closed on
Nov 22, 2010
Sold by
Redmond Fred H
Bought by
Redmond Fred and Fred Redmond Trust
Purchase Details
Closed on
Mar 24, 2000
Sold by
Shan Darling and Shan Louella
Bought by
Redmond Fred H
Home Financials for this Owner
Home Financials are based on the most recent Mortgage that was taken out on this home.
Original Mortgage
$204,000
Outstanding Balance
$68,889
Interest Rate
8.24%
Estimated Equity
$884,941
Create a Home Valuation Report for This Property
The Home Valuation Report is an in-depth analysis detailing your home's value as well as a comparison with similar homes in the area
Home Values in the Area
Average Home Value in this Area
Purchase History
| Date | Buyer | Sale Price | Title Company |
|---|---|---|---|
| Redmond Fred | -- | Accommodation | |
| Redmond Fred | -- | Servicelink | |
| Redmond Fred | -- | None Available | |
| Redmond Fred | -- | None Available | |
| Redmond Fred H | $255,000 | Southland Title Corporation |
Source: Public Records
Mortgage History
| Date | Status | Borrower | Loan Amount |
|---|---|---|---|
| Open | Redmond Fred H | $204,000 |
Source: Public Records
Tax History
| Year | Tax Paid | Tax Assessment Tax Assessment Total Assessment is a certain percentage of the fair market value that is determined by local assessors to be the total taxable value of land and additions on the property. | Land | Improvement |
|---|---|---|---|---|
| 2025 | $4,495 | $403,062 | $283,555 | $119,507 |
| 2024 | $4,495 | $395,159 | $277,995 | $117,164 |
| 2023 | $4,392 | $387,411 | $272,544 | $114,867 |
| 2022 | $4,304 | $379,815 | $267,200 | $112,615 |
| 2021 | $4,077 | $362,074 | $261,961 | $100,113 |
| 2020 | $4,039 | $358,362 | $259,275 | $99,087 |
| 2019 | $3,988 | $351,336 | $254,191 | $97,145 |
| 2018 | $3,927 | $344,448 | $249,207 | $95,241 |
| 2017 | $3,766 | $337,695 | $244,321 | $93,374 |
| 2016 | $3,693 | $331,074 | $239,530 | $91,544 |
| 2015 | $3,644 | $326,101 | $235,932 | $90,169 |
| 2014 | $3,566 | $319,714 | $231,311 | $88,403 |
Source: Public Records
Map
Nearby Homes
- 321 N Starfire St
- 240 S Orange Acres Dr
- 401 N Deerfield St
- 415 S Brook Ln
- 135 N Laurie Ann Ln
- 4358 E Holtwood Ave
- 5489 E Suncrest Rd
- 5291 E Rural Ridge Cir
- 645 S Andover Dr
- 5573 E Vista Del Rio
- 5559 E Vista Del Dia
- 5516 E Vista Del Dia
- 317 S Vista Del Canon
- 5532 E Vista Del Este
- 5548 E Vista Del Este
- 18501 Woodwind Ln
- 5624 E Vista Del Valle
- 2811 N Roxbury St
- 1971 Avenida Del Sol
- 1968 Via de la Luna
- 4915 E Florence Cir
- 4911 E Florence Cir
- 4910 E Wasatch Dr
- 4912 E Wasatch Dr
- 4917 E Florence Cir
- 4914 E Wasatch Dr
- 4912 E Florence Cir
- 4914 E Florence Cir
- 4910 E Florence Cir
- 4916 E Wasatch Dr
- 4916 E Florence Cir
- 199 N Deana St
- 201 N Deana St
- 197 N Deana St
- 195 N Deana St
- 4913 E Gerda Dr
- 4907 E Wasatch Dr
- 4909 E Wasatch Dr
- 4915 E Gerda Dr
- 4911 E Gerda Dr