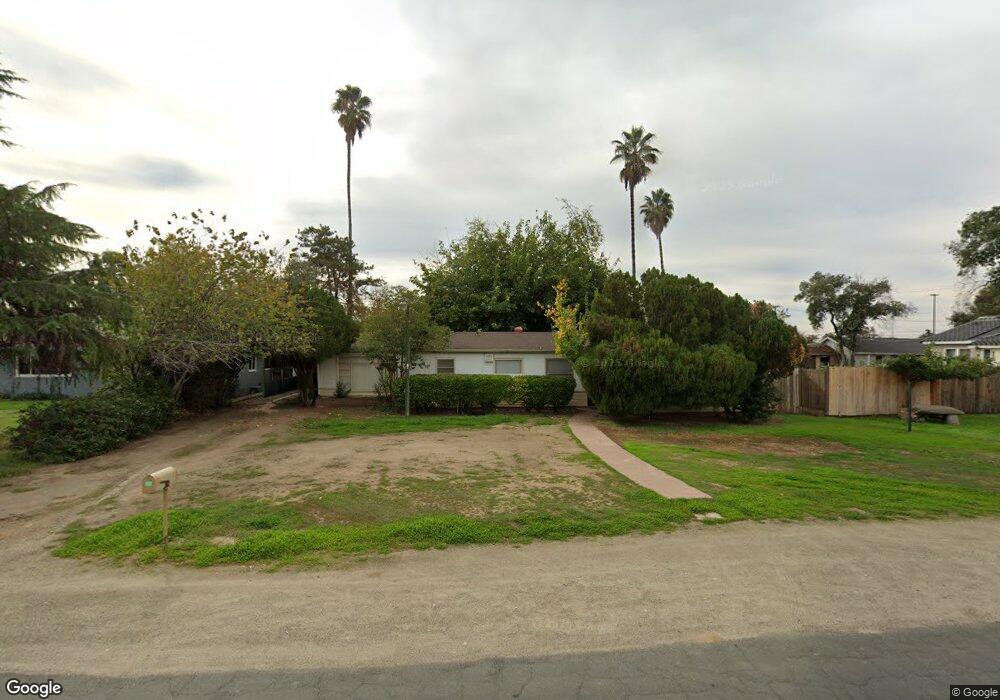
4914 E Tyler Ave Fresno, CA 93727
Roosevelt NeighborhoodEstimated Value: $333,000 - $424,000
3
Beds
1
Bath
1,278
Sq Ft
$286/Sq Ft
Est. Value
About This Home
This home is located at 4914 E Tyler Ave, Fresno, CA 93727 and is currently estimated at $365,792, approximately $286 per square foot. 4914 E Tyler Ave is a home located in Fresno County with nearby schools including Ewing Elementary School, Scandinavian Middle School, and Mclane High School.
Ownership History
Date
Name
Owned For
Owner Type
Purchase Details
Closed on
May 17, 2006
Sold by
Thao Sandy
Bought by
Najera James Garcia
Current Estimated Value
Home Financials for this Owner
Home Financials are based on the most recent Mortgage that was taken out on this home.
Original Mortgage
$53,600
Interest Rate
6.17%
Mortgage Type
Stand Alone Second
Purchase Details
Closed on
Apr 12, 2002
Sold by
Basmajian Michael Wayne and Matano Darlene Elaine Basmajian
Bought by
Thao Sandy
Home Financials for this Owner
Home Financials are based on the most recent Mortgage that was taken out on this home.
Original Mortgage
$87,000
Interest Rate
8.27%
Purchase Details
Closed on
Mar 20, 2002
Sold by
Basmajian Lynne Ellen
Bought by
Basmajian Michael Wayne
Home Financials for this Owner
Home Financials are based on the most recent Mortgage that was taken out on this home.
Original Mortgage
$87,000
Interest Rate
8.27%
Create a Home Valuation Report for This Property
The Home Valuation Report is an in-depth analysis detailing your home's value as well as a comparison with similar homes in the area
Home Values in the Area
Average Home Value in this Area
Purchase History
| Date | Buyer | Sale Price | Title Company |
|---|---|---|---|
| Najera James Garcia | $268,000 | First American Title Company | |
| Thao Sandy | $87,000 | First American Title Ins Co | |
| Basmajian Michael Wayne | -- | First American Title Ins Co | |
| Matano Darlene Elaine Basmajian | -- | First American Title Ins Co |
Source: Public Records
Mortgage History
| Date | Status | Borrower | Loan Amount |
|---|---|---|---|
| Closed | Najera James Garcia | $53,600 | |
| Open | Najera James Garcia | $214,400 | |
| Previous Owner | Thao Sandy | $87,000 |
Source: Public Records
Tax History
| Year | Tax Paid | Tax Assessment Tax Assessment Total Assessment is a certain percentage of the fair market value that is determined by local assessors to be the total taxable value of land and additions on the property. | Land | Improvement |
|---|---|---|---|---|
| 2025 | $3,685 | $290,000 | $75,000 | $215,000 |
| 2023 | $3,202 | $256,600 | $55,900 | $200,700 |
| 2022 | $3,100 | $246,800 | $53,800 | $193,000 |
| 2021 | $2,569 | $205,800 | $44,900 | $160,900 |
| 2020 | $536 | $183,800 | $40,100 | $143,700 |
| 2019 | $458 | $174,400 | $38,100 | $136,300 |
| 2018 | $2,022 | $171,100 | $37,400 | $133,700 |
| 2017 | $1,892 | $160,000 | $35,000 | $125,000 |
| 2016 | $1,782 | $153,098 | $38,071 | $115,027 |
| 2015 | $1,754 | $150,800 | $37,500 | $113,300 |
| 2014 | $1,639 | $141,300 | $35,200 | $106,100 |
Source: Public Records
Map
Nearby Homes
- 5009 E Clay Ave
- 5011 E Harvey Ave
- 4873 E Pine Ave
- 4774 E Hammond Ave
- 1353 N Adler Ave
- 4984 E Belmont Ave
- 5036 E Sooner Dr
- 4703 E Thomas Ave
- 4855 E Washington Ave
- 1223 N Sylmar Ave
- 4762 E Grant Ave
- 5181 E Olive Ave Unit 117
- 5181 E Olive Ave Unit 113
- 5180 E Hedges Ave
- 1745 N Winery Ave Unit 102
- 1221 N Peach Ave Unit 142
- 1221 N Peach Ave Unit 101
- 4877 E Illinois Ave
- 5097 E Carmen Ave
- 5225 E Belmont Ave
- 4920 E Tyler Ave
- 4911 E Tyler Ave
- 4921 E Tyler Ave
- 912 N Winery Ave
- 4905 E Tyler Ave
- 4929 E Tyler Ave
- 4896 E Tyler Ave
- 915 N Winery Ave
- 4895 E Tyler Ave
- 4935 E Tyler Ave
- 1036 N Winery Ave
- 909 N Winery Ave
- 834 N Winery Ave
- 4891 E Tyler Ave
- 4944 E Tyler Ave
- 4884 E Tyler Ave
- 4923 E Harvey Ave
- 929 N Fine Ave
- 4885 E Tyler Ave
- 1037 N Winery Ave
Your Personal Tour Guide
Ask me questions while you tour the home.