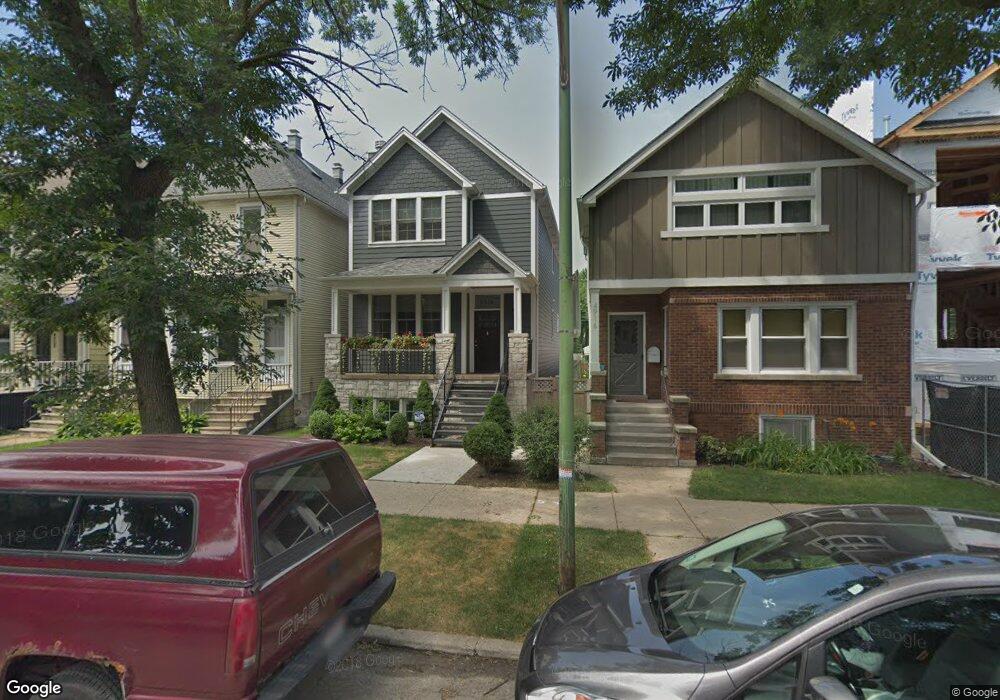
4914 N Seeley Ave Unit 2 Chicago, IL 60625
Ravenswood NeighborhoodEstimated Value: $1,554,667 - $1,867,000
4
Beds
5
Baths
2,699
Sq Ft
$623/Sq Ft
Est. Value
About This Home
This home is located at 4914 N Seeley Ave Unit 2, Chicago, IL 60625 and is currently estimated at $1,681,417, approximately $622 per square foot. 4914 N Seeley Ave Unit 2 is a home located in Cook County with nearby schools including McPherson Elementary School, Amundsen High School, and Lycee Francais de Chicago.
Ownership History
Date
Name
Owned For
Owner Type
Purchase Details
Closed on
Feb 6, 2015
Sold by
Goss Philip
Bought by
Emerson Joshua and Emerson Priya
Current Estimated Value
Home Financials for this Owner
Home Financials are based on the most recent Mortgage that was taken out on this home.
Original Mortgage
$946,000
Outstanding Balance
$717,547
Interest Rate
3.5%
Mortgage Type
New Conventional
Estimated Equity
$963,870
Purchase Details
Closed on
Apr 1, 2014
Sold by
Smbp Holdings Inc
Bought by
Goss Philip
Home Financials for this Owner
Home Financials are based on the most recent Mortgage that was taken out on this home.
Original Mortgage
$929,600
Interest Rate
3.75%
Mortgage Type
Adjustable Rate Mortgage/ARM
Purchase Details
Closed on
Aug 5, 2013
Sold by
Amey Barbara
Bought by
Smbp Holdings Inc
Purchase Details
Closed on
Apr 11, 2013
Sold by
Albany Bank & Trust Company Na
Bought by
Amey Barbara and Barbara Amey Trust
Create a Home Valuation Report for This Property
The Home Valuation Report is an in-depth analysis detailing your home's value as well as a comparison with similar homes in the area
Home Values in the Area
Average Home Value in this Area
Purchase History
| Date | Buyer | Sale Price | Title Company |
|---|---|---|---|
| Emerson Joshua | $1,182,500 | None Available | |
| Goss Philip | $1,162,000 | None Available | |
| Smbp Holdings Inc | $360,000 | None Available | |
| Amey Barbara | -- | None Available |
Source: Public Records
Mortgage History
| Date | Status | Borrower | Loan Amount |
|---|---|---|---|
| Open | Emerson Joshua | $946,000 | |
| Previous Owner | Goss Philip | $929,600 |
Source: Public Records
Tax History Compared to Growth
Tax History
| Year | Tax Paid | Tax Assessment Tax Assessment Total Assessment is a certain percentage of the fair market value that is determined by local assessors to be the total taxable value of land and additions on the property. | Land | Improvement |
|---|---|---|---|---|
| 2024 | $19,973 | $126,755 | $31,561 | $95,194 |
| 2023 | $19,449 | $97,979 | $25,376 | $72,603 |
| 2022 | $19,449 | $97,979 | $25,376 | $72,603 |
| 2021 | $19,033 | $97,979 | $25,376 | $72,603 |
| 2020 | $19,058 | $88,654 | $13,322 | $75,332 |
| 2019 | $18,884 | $97,423 | $13,322 | $84,101 |
| 2018 | $18,566 | $97,423 | $13,322 | $84,101 |
| 2017 | $17,012 | $82,403 | $11,419 | $70,984 |
| 2016 | $16,004 | $82,403 | $11,419 | $70,984 |
| 2015 | $15,252 | $85,857 | $11,419 | $74,438 |
| 2014 | $12,799 | $68,983 | $8,247 | $60,736 |
| 2013 | $6,437 | $35,393 | $8,247 | $27,146 |
Source: Public Records
Map
Nearby Homes
- 4814 N Damen Ave Unit 209
- 4906 N Winchester Ave
- 1949 W Argyle St Unit 19491
- 4948 N Winchester Ave
- 5015 N Damen Ave
- 2248 W Ainslie St
- 4726 N Winchester Ave Unit C
- 4726 N Winchester Ave Unit F
- 5401-5447 N Wolcott Ave
- 4947 N Wolcott Ave Unit 1B
- 4909 N Wolcott Ave Unit 2B
- 2135 W Leland Ave
- 4929 N Wolcott Ave Unit 1A
- 5013 N Wolcott Ave Unit 3W
- 2201 W Winona St Unit 2201G
- 5117 N Winchester Ave Unit 2S
- 2224 W Eastwood Ave
- 5221 N Hoyne Ave Unit 3
- 5011 N Western Ave
- 5058 N Claremont Ave Unit 2E
- 4914 N Seeley Ave
- 4916 N Seeley Ave
- 4910 N Seeley Ave
- 4910 N Seeley Ave
- 4918 N Seeley Ave
- 4908 N Seeley Ave Unit 2
- 4908 N Seeley Ave Unit 1
- 4906 N Seeley Ave
- 4902 N Seeley Ave
- 4902 N Seeley Ave Unit 1
- 4902 N Seeley Ave
- 4902 N Seeley Ave Unit 3
- 4924 N Seeley Ave
- 4900 N Seeley Ave
- 4911 N Seeley Ave Unit 2
- 4928 N Seeley Ave
- 4915 N Hoyne Ave Unit 2S
- 4915 N Hoyne Ave Unit 2N
- 4915 N Hoyne Ave Unit 1S
- 4915 N Hoyne Ave Unit 1N