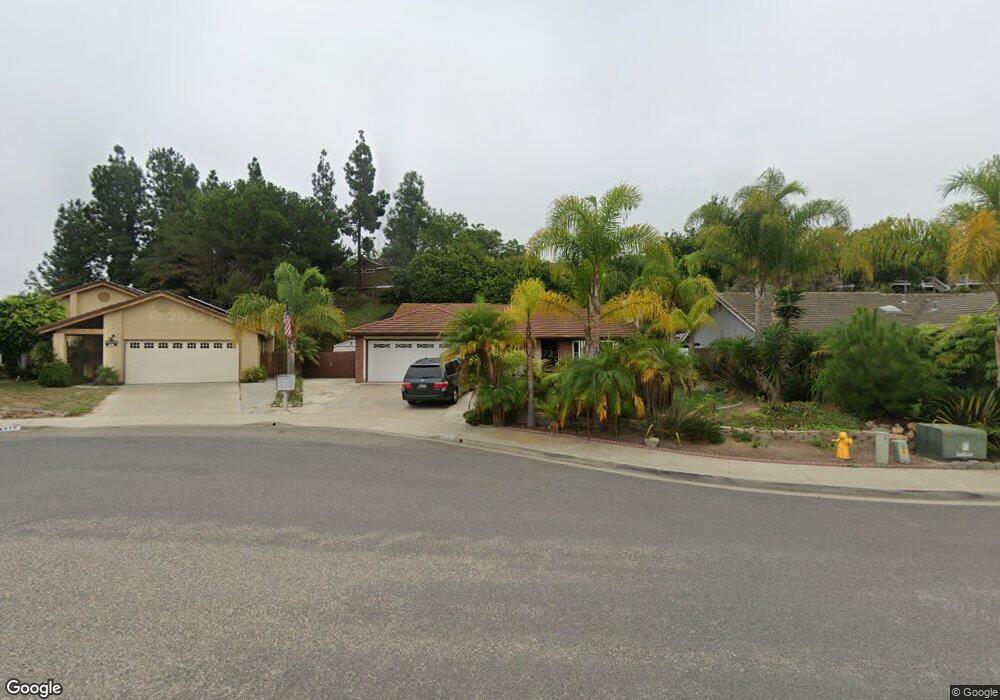
4915 Glenhaven Dr Oceanside, CA 92056
Peacock NeighborhoodEstimated Value: $841,000 - $894,000
3
Beds
2
Baths
1,603
Sq Ft
$540/Sq Ft
Est. Value
About This Home
This home is located at 4915 Glenhaven Dr, Oceanside, CA 92056 and is currently estimated at $866,169, approximately $540 per square foot. 4915 Glenhaven Dr is a home located in San Diego County with nearby schools including T.H.E Leadership Academy, Roosevelt Middle School, and Vista High School.
Ownership History
Date
Name
Owned For
Owner Type
Purchase Details
Closed on
Sep 21, 2001
Sold by
Poumele Pululipano and Poumele Jessica
Bought by
Kostadinov Gueorgui S and Kostadinova Veselina I
Current Estimated Value
Home Financials for this Owner
Home Financials are based on the most recent Mortgage that was taken out on this home.
Original Mortgage
$200,000
Outstanding Balance
$77,535
Interest Rate
6.91%
Estimated Equity
$788,634
Purchase Details
Closed on
Sep 7, 1999
Sold by
Kennedy Donald A and Kennedy Diane H
Bought by
Poumele Pululipano and Poumele Jessica
Home Financials for this Owner
Home Financials are based on the most recent Mortgage that was taken out on this home.
Original Mortgage
$148,800
Interest Rate
7.97%
Mortgage Type
Balloon
Purchase Details
Closed on
Mar 29, 1988
Create a Home Valuation Report for This Property
The Home Valuation Report is an in-depth analysis detailing your home's value as well as a comparison with similar homes in the area
Home Values in the Area
Average Home Value in this Area
Purchase History
| Date | Buyer | Sale Price | Title Company |
|---|---|---|---|
| Kostadinov Gueorgui S | $250,000 | Chicago Title Co | |
| Poumele Pululipano | $186,000 | American Title Ins Co | |
| -- | $121,900 | -- |
Source: Public Records
Mortgage History
| Date | Status | Borrower | Loan Amount |
|---|---|---|---|
| Open | Kostadinov Gueorgui S | $200,000 | |
| Previous Owner | Poumele Pululipano | $148,800 | |
| Closed | Poumele Pululipano | $18,600 | |
| Closed | Kostadinov Gueorgui S | $25,000 |
Source: Public Records
Tax History
| Year | Tax Paid | Tax Assessment Tax Assessment Total Assessment is a certain percentage of the fair market value that is determined by local assessors to be the total taxable value of land and additions on the property. | Land | Improvement |
|---|---|---|---|---|
| 2025 | $3,908 | $369,304 | $162,491 | $206,813 |
| 2024 | $3,908 | $362,063 | $159,305 | $202,758 |
| 2023 | $3,813 | $354,965 | $156,182 | $198,783 |
| 2022 | $3,801 | $348,006 | $153,120 | $194,886 |
| 2021 | $3,716 | $341,183 | $150,118 | $191,065 |
| 2020 | $3,702 | $337,685 | $148,579 | $189,106 |
| 2019 | $3,646 | $331,065 | $145,666 | $185,399 |
| 2018 | $3,465 | $324,574 | $142,810 | $181,764 |
| 2017 | $3,400 | $318,210 | $140,010 | $178,200 |
| 2016 | $3,318 | $311,971 | $137,265 | $174,706 |
| 2015 | $3,304 | $307,286 | $135,204 | $172,082 |
| 2014 | $3,221 | $301,268 | $132,556 | $168,712 |
Source: Public Records
Map
Nearby Homes
- 1515 Fig Tree Way
- 1508 Laurelwood Way
- 1549 Fig Tree Way
- 1433 Grey Oaks Ct
- 1700 Laurelwood Way
- 1413 Eastview Ct
- 1728 Valley Oak Way
- 1715 Crabapple Way
- 1376 Darwin Dr
- 1400 Darwin Dr
- 1517 Leonis Place
- 527 Mynah Place
- 1521 Temple Heights Dr
- 1523 Temple Heights Dr
- 1350 Marabou Ln
- 475 Taylor Dr
- 1247 Sunglow Dr
- 4719 Mystik Rd
- 441 Adobe Estates Dr
- 1540 Highridge Dr
- 4913 Glenhaven Dr
- 4917 Glenhaven Dr
- 4911 Glenhaven Dr
- 4919 Glenhaven Dr
- 4909 Glenhaven Dr
- 4918 Glenhaven Dr
- 4912 Glenhaven Dr
- 4914 Glenhaven Dr
- 4916 Glenhaven Dr
- 4910 Glenhaven Dr
- 4907 Glenhaven Dr
- 4908 Glenhaven Dr
- 4905 Glenhaven Dr
- 4906 Glenhaven Dr
- 4913 Meadowbrook Dr
- 4911 Meadowbrook Dr
- 4903 Glenhaven Dr
- 4917 Meadowbrook Dr
- 4904 Glenhaven Dr
- 4909 Meadowbrook Dr
Your Personal Tour Guide
Ask me questions while you tour the home.