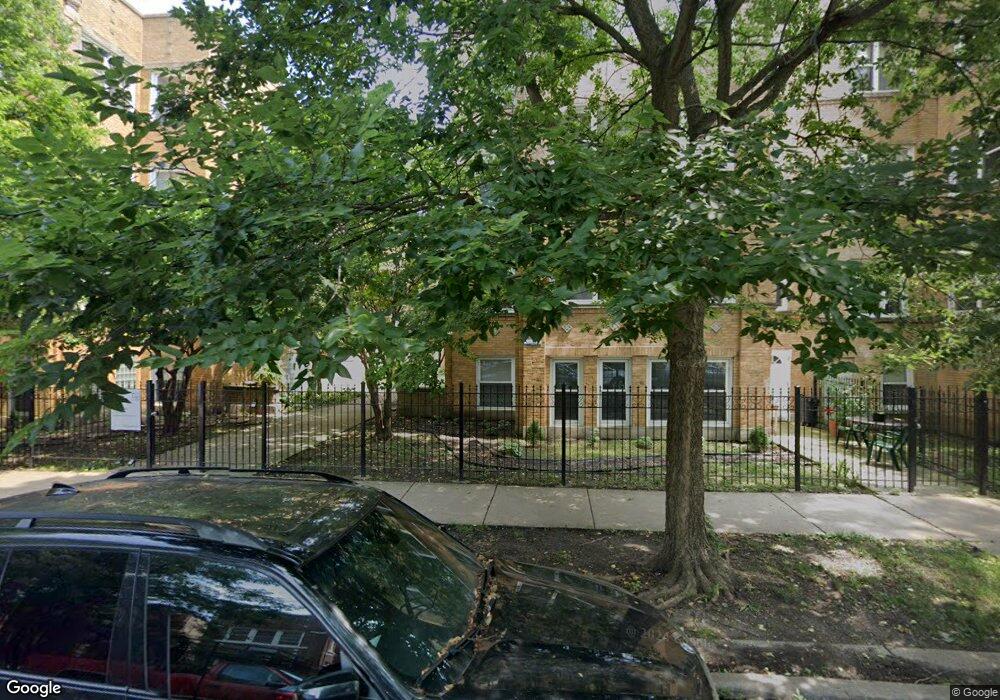
4915 N Avers Ave Unit 49153CN Chicago, IL 60625
Albany Park NeighborhoodEstimated Value: $193,000 - $201,925
--
Bed
--
Bath
--
Sq Ft
0.28
Acres
About This Home
This home is located at 4915 N Avers Ave Unit 49153CN, Chicago, IL 60625 and is currently estimated at $196,231. 4915 N Avers Ave Unit 49153CN is a home located in Cook County with nearby schools including Volta Elementary School, Roosevelt High School, and ASPIRA Haugan Middle School.
Ownership History
Date
Name
Owned For
Owner Type
Purchase Details
Closed on
Dec 6, 2024
Sold by
Good Joyce M and Osborne Blake D
Bought by
Beggs Abby M
Current Estimated Value
Home Financials for this Owner
Home Financials are based on the most recent Mortgage that was taken out on this home.
Original Mortgage
$178,965
Outstanding Balance
$177,547
Interest Rate
6.75%
Mortgage Type
New Conventional
Estimated Equity
$18,684
Purchase Details
Closed on
Jan 21, 2010
Sold by
Good Joyce M
Bought by
Good Joyce M and Osborne Blake D
Purchase Details
Closed on
Dec 20, 1999
Sold by
Avers Group Llc
Bought by
Good Joyce M
Home Financials for this Owner
Home Financials are based on the most recent Mortgage that was taken out on this home.
Original Mortgage
$60,000
Interest Rate
7.7%
Create a Home Valuation Report for This Property
The Home Valuation Report is an in-depth analysis detailing your home's value as well as a comparison with similar homes in the area
Home Values in the Area
Average Home Value in this Area
Purchase History
| Date | Buyer | Sale Price | Title Company |
|---|---|---|---|
| Beggs Abby M | $184,500 | None Listed On Document | |
| Beggs Abby M | $184,500 | None Listed On Document | |
| Good Joyce M | -- | None Available | |
| Good Joyce M | $91,000 | Ticor Title Insurance |
Source: Public Records
Mortgage History
| Date | Status | Borrower | Loan Amount |
|---|---|---|---|
| Open | Beggs Abby M | $178,965 | |
| Closed | Beggs Abby M | $178,965 | |
| Previous Owner | Good Joyce M | $60,000 |
Source: Public Records
Tax History Compared to Growth
Tax History
| Year | Tax Paid | Tax Assessment Tax Assessment Total Assessment is a certain percentage of the fair market value that is determined by local assessors to be the total taxable value of land and additions on the property. | Land | Improvement |
|---|---|---|---|---|
| 2024 | -- | $15,762 | $1,886 | $13,876 |
| 2023 | -- | $11,700 | $1,509 | $10,191 |
| 2022 | $0 | $11,700 | $1,509 | $10,191 |
| 2021 | $219 | $11,698 | $1,508 | $10,190 |
| 2020 | $219 | $9,457 | $781 | $8,676 |
| 2019 | $0 | $10,599 | $781 | $9,818 |
| 2018 | $0 | $10,599 | $781 | $9,818 |
| 2017 | $0 | $5,641 | $700 | $4,941 |
| 2016 | $219 | $5,641 | $700 | $4,941 |
| 2015 | $210 | $5,641 | $700 | $4,941 |
| 2014 | $387 | $6,479 | $646 | $5,833 |
| 2013 | $518 | $7,346 | $646 | $6,700 |
Source: Public Records
Map
Nearby Homes
- 4901 N Avers Ave Unit 2
- 3849 W Ainslie St Unit 1
- 4855 N Springfield Ave Unit 3
- 3908 W Ainslie St Unit G
- 4855 N Harding Ave Unit 2
- 4900 N Lawndale Ave Unit G
- 4833 N Harding Ave Unit GDN
- 4833 N Harding Ave Unit 1
- 5033 N Hamlin Ave
- 4919 N Lawndale Ave
- 4923 N Pulaski Rd
- 5007 N Lawndale Ave
- 3711 W Lawrence Ave
- 3752 W Giddings St Unit 3
- 5038 N Harding Ave
- 4903 N Monticello Ave Unit 3
- 3618 W Ainslie St Unit 3W
- 5107 N Springfield Ave Unit B
- 5115 N Springfield Ave Unit B
- 4845 N Keystone Ave Unit 1S
- 4915 N Avers Ave Unit 49153CS
- 4915 N Avers Ave Unit 49151D
- 4915 N Avers Ave Unit 49152CS
- 4915 N Avers Ave Unit 49152CN
- 4915 N Avers Ave Unit 49152D
- 4915 N Avers Ave Unit 49153D
- 4915 N Avers Ave Unit 49151CS
- 4915 N Avers Ave Unit 49151CN
- 4915 N Avers Ave Unit 2D
- 4915 N Avers Ave Unit 2CN
- 4915 N Avers Ave Unit 1D
- 4915 N Avers Ave Unit 1CS
- 4915 N Avers Ave Unit 3D
- 4915 N Avers Ave Unit 2CS
- 4917 N Avers Ave Unit 49172A
- 4917 N Avers Ave Unit 49171A
- 4917 N Avers Ave Unit 4917GB
- 4917 N Avers Ave Unit 49173B
- 4917 N Avers Ave Unit 49173A
- 4917 N Avers Ave Unit 49172B