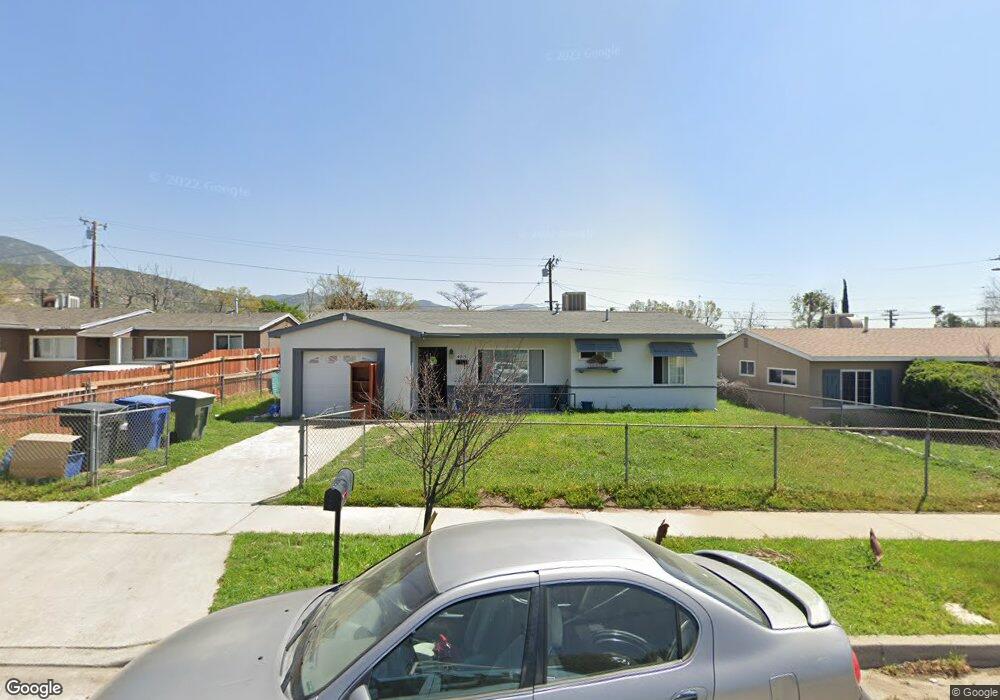
4915 N D St San Bernardino, CA 92407
Cajon NeighborhoodEstimated Value: $406,617 - $479,000
3
Beds
1
Bath
980
Sq Ft
$453/Sq Ft
Est. Value
About This Home
This home is located at 4915 N D St, San Bernardino, CA 92407 and is currently estimated at $443,654, approximately $452 per square foot. 4915 N D St is a home located in San Bernardino County with nearby schools including Hillside Elementary School, Shandin Hills Middle School, and Cajon High School.
Ownership History
Date
Name
Owned For
Owner Type
Purchase Details
Closed on
Feb 4, 2021
Sold by
Rewg Inc
Bought by
Advanced Sales Inc
Current Estimated Value
Purchase Details
Closed on
Feb 6, 2012
Sold by
Advanced Sales Inc
Bought by
Rewg Inc and N D St Trust
Purchase Details
Closed on
Oct 26, 2010
Sold by
Schmidthuber Betty A
Bought by
Advanced Sales Inc and N D St Trust
Purchase Details
Closed on
Mar 17, 2007
Sold by
Safford Vicki L
Bought by
Schmidthuber Betty A
Purchase Details
Closed on
Mar 13, 2007
Sold by
Schmidthuber Betty A
Bought by
Schmidthuber Betty A and The Schmidthuber Family Trust
Purchase Details
Closed on
Nov 12, 2001
Sold by
Schmidthuber Betty A
Bought by
Schmidthuber Betty A and Safford Vicki L
Purchase Details
Closed on
Aug 24, 1998
Sold by
Safford Vicki L
Bought by
Schmidthuber Betty A
Create a Home Valuation Report for This Property
The Home Valuation Report is an in-depth analysis detailing your home's value as well as a comparison with similar homes in the area
Home Values in the Area
Average Home Value in this Area
Purchase History
| Date | Buyer | Sale Price | Title Company |
|---|---|---|---|
| Advanced Sales Inc | -- | First Amer Ttl Ins Co Ncs | |
| Rewg Inc | -- | First American Title Company | |
| Advanced Sales Inc | $84,000 | First American Title Company | |
| Schmidthuber Betty A | -- | None Available | |
| Schmidthuber Betty A | -- | None Available | |
| Schmidthuber Betty A | -- | -- | |
| Schmidthuber Betty A | -- | -- |
Source: Public Records
Tax History Compared to Growth
Tax History
| Year | Tax Paid | Tax Assessment Tax Assessment Total Assessment is a certain percentage of the fair market value that is determined by local assessors to be the total taxable value of land and additions on the property. | Land | Improvement |
|---|---|---|---|---|
| 2025 | $1,489 | $107,393 | $25,121 | $82,272 |
| 2024 | $1,489 | $105,287 | $24,628 | $80,659 |
| 2023 | $1,451 | $103,222 | $24,145 | $79,077 |
| 2022 | $1,450 | $101,198 | $23,672 | $77,526 |
| 2021 | $1,450 | $99,214 | $23,208 | $76,006 |
| 2020 | $1,450 | $98,197 | $22,970 | $75,227 |
| 2019 | $1,410 | $96,272 | $22,520 | $73,752 |
| 2018 | $1,396 | $94,384 | $22,078 | $72,306 |
| 2017 | $1,353 | $92,533 | $21,645 | $70,888 |
| 2016 | $1,313 | $90,719 | $21,221 | $69,498 |
| 2015 | $1,186 | $89,356 | $20,902 | $68,454 |
| 2014 | $1,153 | $87,606 | $20,493 | $67,113 |
Source: Public Records
Map
Nearby Homes
- 4956 N Stoddard Ave
- 4966 N Stoddard Ave
- 4835 Acacia Ave
- 4558 N Mountain View Ave
- 4417 N Mayfield Ave
- 641 W 48th St
- 564 Northpark Blvd
- 5406 N D St
- 187 Carmelita Ln
- 5095 N G St
- 4776 Olivewood Ln
- 5304 Sierra Rd
- 4655 Woodbend Ln
- 193 E 48th St
- 661 W 55th St
- 0 W Hill Dr Unit IG25219633
- 4675 Sepulveda Ave
- 5734 N E St
- 5431 Monte Dr
- 3977 Acre Ln
- 4925 N D St
- 4905 N D St
- 4935 N D St
- 4914 N Mayfield Ave
- 4904 N Mayfield Ave
- 4926 N Mayfield Ave
- 4916 N D St
- 4945 N D St
- 4938 N Mayfield San Bernardino
- 4938 N Mayfield Ave
- 4926 N D St
- 4906 N D St
- 4938 N Mayfield San Bernardino
- 4936 N D St
- 395 W 49th St
- 405 W 49th St
- 385 W 49th St
- 4948 N Mayfield Ave
- 4955 N D St
- 415 W 49th St