Estimated Value: $406,000 - $594,000
3
Beds
3
Baths
2,121
Sq Ft
$256/Sq Ft
Est. Value
About This Home
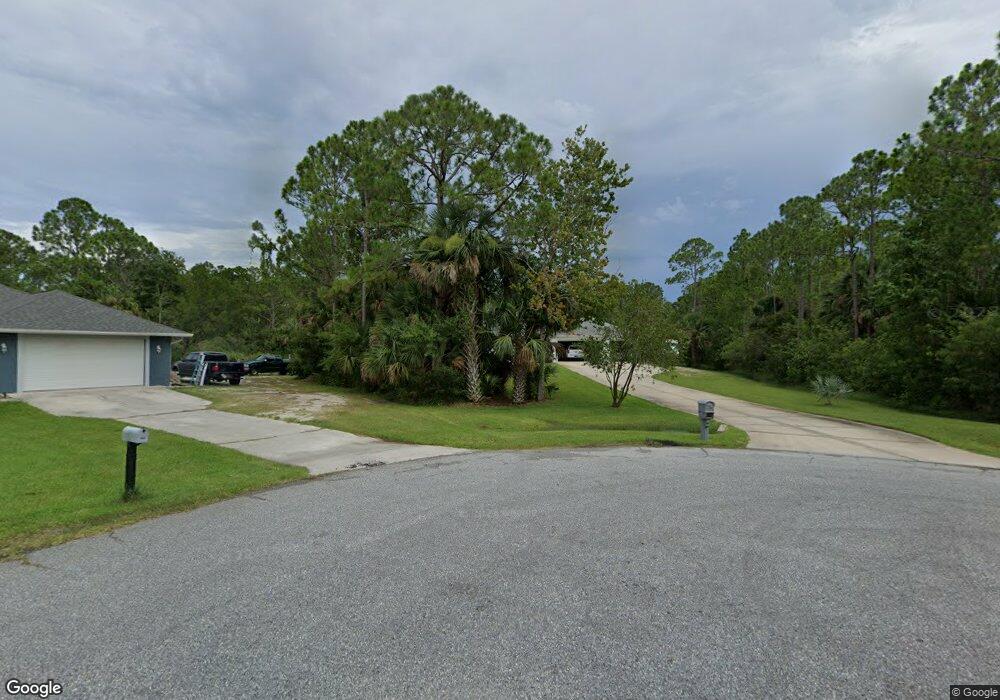
This home is located at 4915 Shade Tree St, Cocoa, FL 32926 and is currently estimated at $542,967, approximately $255 per square foot. 4915 Shade Tree St is a home located in Brevard County with nearby schools including Saturn Elementary School and Cocoa High School.
Ownership History
Date
Name
Owned For
Owner Type
Purchase Details
Closed on
Dec 13, 2012
Sold by
Nugent Steven Michael
Bought by
Nugent Steven Michael and Nugent Delia
Current Estimated Value
Home Financials for this Owner
Home Financials are based on the most recent Mortgage that was taken out on this home.
Original Mortgage
$155,600
Outstanding Balance
$28,611
Interest Rate
3.36%
Estimated Equity
$514,356
Purchase Details
Closed on
Mar 11, 2002
Sold by
Moren Patrick J and Moren Jody K
Bought by
Nugent Steven Michael
Home Financials for this Owner
Home Financials are based on the most recent Mortgage that was taken out on this home.
Original Mortgage
$27,222
Interest Rate
6.98%
Purchase Details
Closed on
Sep 30, 1999
Sold by
Bernhardt William T and Bernhardt Kathy A
Bought by
Moren Patrick J and Moren Jody K
Create a Home Valuation Report for This Property
The Home Valuation Report is an in-depth analysis detailing your home's value as well as a comparison with similar homes in the area
Home Values in the Area
Average Home Value in this Area
Purchase History
| Date | Buyer | Sale Price | Title Company |
|---|---|---|---|
| Nugent Steven Michael | -- | Attorney | |
| Nugent Steven Michael | $33,500 | -- | |
| Moren Patrick J | $20,900 | -- |
Source: Public Records
Mortgage History
| Date | Status | Borrower | Loan Amount |
|---|---|---|---|
| Open | Nugent Steven Michael | $155,600 | |
| Previous Owner | Nugent Steven Michael | $27,222 |
Source: Public Records
Tax History
| Year | Tax Paid | Tax Assessment Tax Assessment Total Assessment is a certain percentage of the fair market value that is determined by local assessors to be the total taxable value of land and additions on the property. | Land | Improvement |
|---|---|---|---|---|
| 2025 | $3,041 | $264,520 | -- | -- |
| 2024 | $2,997 | $228,230 | -- | -- |
| 2023 | $2,997 | $221,590 | -- | -- |
| 2022 | $2,807 | $215,140 | $0 | $0 |
| 2021 | $2,870 | $208,880 | $0 | $0 |
| 2020 | $2,810 | $206,000 | $0 | $0 |
| 2019 | $2,761 | $201,370 | $0 | $0 |
| 2018 | $2,769 | $197,620 | $0 | $0 |
| 2017 | $2,797 | $193,560 | $0 | $0 |
| 2016 | $2,839 | $189,580 | $40,250 | $149,330 |
| 2015 | $2,883 | $188,270 | $40,250 | $148,020 |
| 2014 | $2,890 | $186,780 | $36,800 | $149,980 |
Source: Public Records
Map
Nearby Homes
- TBD Rayburn Rd
- 1870 Britt Rd
- 4550 Highway 524
- 5101 Craig Rd
- 1325 Friday Rd
- 634 Outer Dr
- 427 Horseshoe Bend Cir Unit 151
- 694 Outer Dr Unit 184
- 755 Outer Dr Unit 362
- 4655 Rector Rd
- 365 Outer Dr
- 785 Outer Dr
- 495 Outer Dr Unit 201
- 336 Horseshoe Bend Cir Unit 197
- 189 Woodsmill Blvd
- 344 Outer Dr Unit 323
- 4412 Talbot Blvd
- 425 Outer Dr Unit 208
- 122 Aquarius Terrace Unit 29
- 104 Woodsmill Blvd Unit 20
- 4900 Shade Tree St
- 1670 Friday Rd
- 4910 Shade Tree St
- 4920 Shade Tree St
- 4945 Shade Tree St
- 4930 Shade Tree St
- 1680 Friday Rd
- 4908 Corfu Dr
- 4940 Shade Tree St
- 4955 Shade Tree St
- 4916 Corfu Dr
- 4950 Shade Tree St
- 4924 Corfu Dr
- 4965 Shade Tree St
- 4900 Corfu Dr
- 4845 Rayburn Rd
- 4960 Shade Tree St
- 4932 Corfu Dr
- 4865 Rayburn Rd
- 4909 Corfu Dr
Your Personal Tour Guide
Ask me questions while you tour the home.