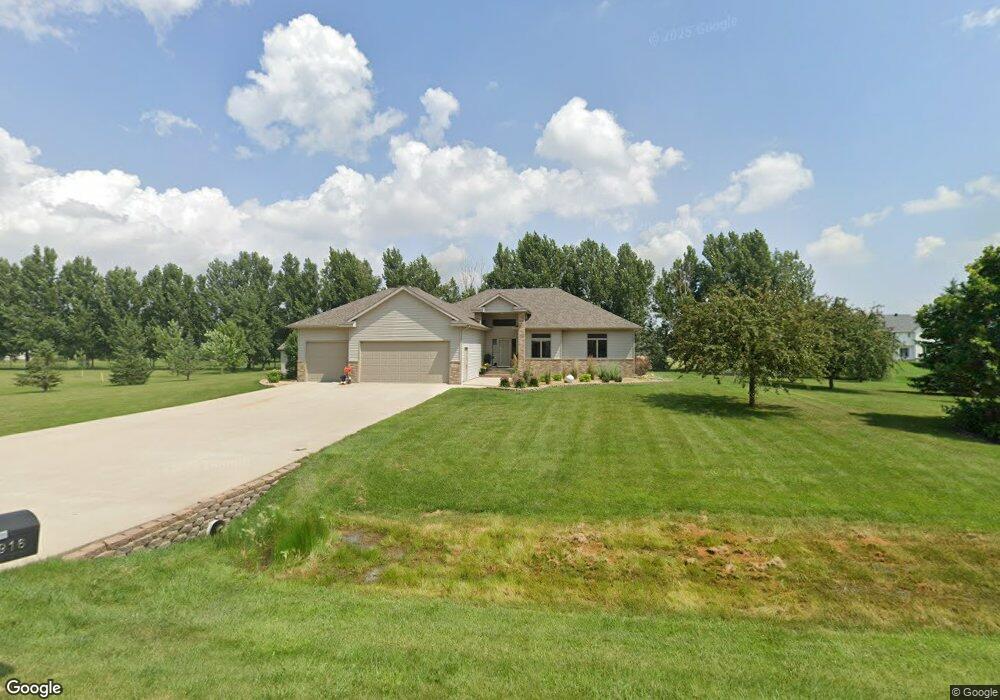
4916 2nd St E West Fargo, ND 58078
McMahon Estates NeighborhoodEstimated Value: $608,000 - $625,912
4
Beds
4
Baths
1,816
Sq Ft
$340/Sq Ft
Est. Value
About This Home
This home is located at 4916 2nd St E, West Fargo, ND 58078 and is currently estimated at $616,956, approximately $339 per square foot. 4916 2nd St E is a home located in Cass County with nearby schools including Liberty Middle School and West Fargo Sheyenne High School.
Ownership History
Date
Name
Owned For
Owner Type
Purchase Details
Closed on
Jul 22, 2016
Sold by
Debuhr David A and Debuhr Lynda P
Bought by
Rogen Ryan Dale and Rogen Rachel Ann
Current Estimated Value
Home Financials for this Owner
Home Financials are based on the most recent Mortgage that was taken out on this home.
Original Mortgage
$360,000
Interest Rate
3.6%
Mortgage Type
Commercial
Purchase Details
Closed on
Mar 21, 2008
Sold by
Schubert Paul G and Schubert Joy E
Bought by
Debuhr David A and Debuhr Lynda P
Home Financials for this Owner
Home Financials are based on the most recent Mortgage that was taken out on this home.
Original Mortgage
$150,000
Interest Rate
6.1%
Mortgage Type
New Conventional
Create a Home Valuation Report for This Property
The Home Valuation Report is an in-depth analysis detailing your home's value as well as a comparison with similar homes in the area
Home Values in the Area
Average Home Value in this Area
Purchase History
| Date | Buyer | Sale Price | Title Company |
|---|---|---|---|
| Rogen Ryan Dale | $400,000 | None Available | |
| Debuhr David A | -- | -- |
Source: Public Records
Mortgage History
| Date | Status | Borrower | Loan Amount |
|---|---|---|---|
| Closed | Rogen Ryan Dale | $360,000 | |
| Previous Owner | Debuhr David A | $150,000 |
Source: Public Records
Tax History Compared to Growth
Tax History
| Year | Tax Paid | Tax Assessment Tax Assessment Total Assessment is a certain percentage of the fair market value that is determined by local assessors to be the total taxable value of land and additions on the property. | Land | Improvement |
|---|---|---|---|---|
| 2024 | $8,145 | $294,700 | $77,500 | $217,200 |
| 2023 | $7,456 | $268,300 | $60,000 | $208,300 |
| 2022 | $7,114 | $250,300 | $60,000 | $190,300 |
| 2021 | $6,728 | $214,350 | $31,250 | $183,100 |
| 2020 | $7,193 | $202,200 | $31,250 | $170,950 |
| 2019 | $7,145 | $195,750 | $31,250 | $164,500 |
| 2018 | $7,191 | $201,150 | $31,250 | $169,900 |
| 2017 | $6,986 | $196,900 | $31,250 | $165,650 |
| 2016 | $6,622 | $203,450 | $31,250 | $172,200 |
| 2015 | $6,502 | $182,450 | $28,800 | $153,650 |
| 2014 | $6,506 | $170,500 | $28,800 | $141,700 |
| 2013 | $6,320 | $158,300 | $22,450 | $135,850 |
Source: Public Records
Map
Nearby Homes
- 215 51st Ave E
- 6152 Wildflower Dr
- 6976 65th St S
- 7108 65th St S
- 7018 65th St S
- 6965 65th St S
- 6977 65th St S
- 6988 65th St S
- 7114 65th St S
- 6970 65th St S
- 6971 65th St S
- 7024 65th St S
- 7036 65th St S
- 7102 65th St S
- 7030 65th St S
- 7006 65th St S
- 6982 65th St S
- 7120 65th St S
- 6994 65th St S
- 7012 65th St S