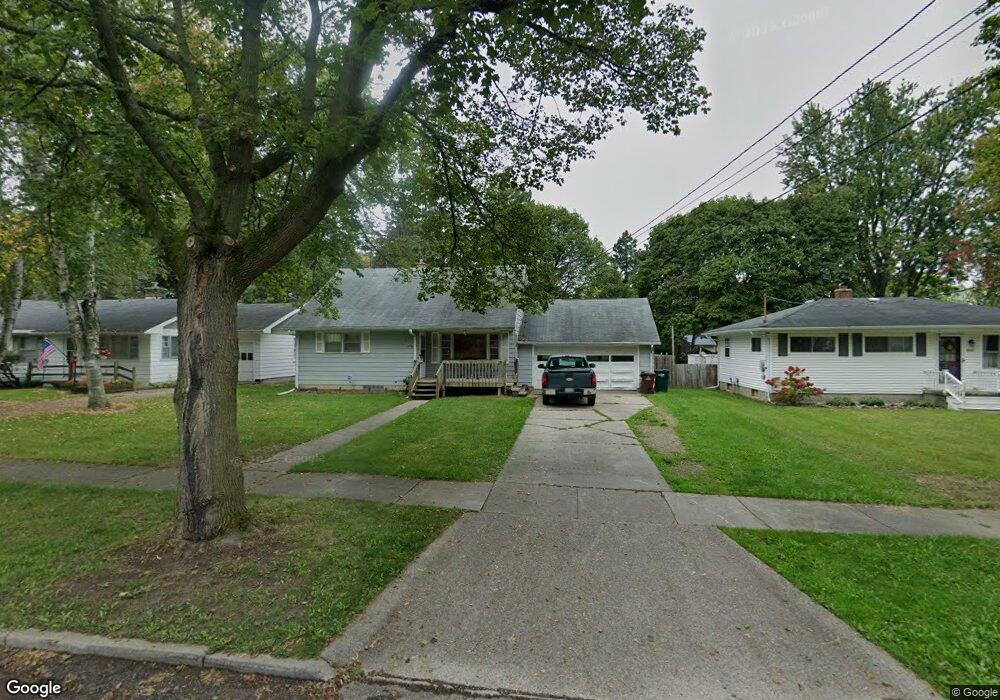
4916 Ora St Lansing, MI 48910
Old Everett NeighborhoodEstimated Value: $164,186 - $205,000
3
Beds
2
Baths
1,878
Sq Ft
$98/Sq Ft
Est. Value
About This Home
This home is located at 4916 Ora St, Lansing, MI 48910 and is currently estimated at $183,547, approximately $97 per square foot. 4916 Ora St is a home located in Ingham County with nearby schools including Kendon School, Attwood School, and Everett High School.
Ownership History
Date
Name
Owned For
Owner Type
Purchase Details
Closed on
Jun 30, 2008
Sold by
Alden Susan M
Bought by
Torres Jose R
Current Estimated Value
Home Financials for this Owner
Home Financials are based on the most recent Mortgage that was taken out on this home.
Original Mortgage
$101,195
Outstanding Balance
$64,919
Interest Rate
5.96%
Mortgage Type
FHA
Estimated Equity
$118,628
Purchase Details
Closed on
Apr 9, 2001
Sold by
Alden Mildred J
Bought by
Alden Mildred J and Alden Susan
Create a Home Valuation Report for This Property
The Home Valuation Report is an in-depth analysis detailing your home's value as well as a comparison with similar homes in the area
Home Values in the Area
Average Home Value in this Area
Purchase History
| Date | Buyer | Sale Price | Title Company |
|---|---|---|---|
| Torres Jose R | $105,000 | Tri County Title Agency Llc | |
| Alden Mildred J | -- | -- |
Source: Public Records
Mortgage History
| Date | Status | Borrower | Loan Amount |
|---|---|---|---|
| Open | Torres Jose R | $101,195 |
Source: Public Records
Tax History Compared to Growth
Tax History
| Year | Tax Paid | Tax Assessment Tax Assessment Total Assessment is a certain percentage of the fair market value that is determined by local assessors to be the total taxable value of land and additions on the property. | Land | Improvement |
|---|---|---|---|---|
| 2025 | $3,014 | $73,200 | $11,600 | $61,600 |
| 2024 | $24 | $65,900 | $11,600 | $54,300 |
| 2023 | $2,826 | $60,300 | $11,600 | $48,700 |
| 2022 | $2,548 | $51,600 | $10,600 | $41,000 |
| 2021 | $2,495 | $47,300 | $5,400 | $41,900 |
| 2020 | $2,480 | $44,000 | $5,400 | $38,600 |
| 2019 | $2,377 | $42,000 | $5,400 | $36,600 |
| 2018 | $2,227 | $41,100 | $5,400 | $35,700 |
| 2017 | $2,132 | $41,100 | $5,400 | $35,700 |
| 2016 | $2,054 | $38,200 | $5,400 | $32,800 |
| 2015 | $2,054 | $36,700 | $10,797 | $25,903 |
| 2014 | $2,054 | $36,400 | $7,327 | $29,073 |
Source: Public Records
Map
Nearby Homes
- 4800 Ora St
- 5011 Stafford Ave
- 105 Cox Blvd
- 201 E Syringa Dr
- 111 E Potter Ave
- 600 W Cavanaugh Rd
- 833 Dornell Ave
- 4407 Burchfield Ave
- 5006 Delbrook Ave
- 100 Fenton St
- 4935 Delray Dr
- 4125 Lowcroft Ave
- 4022 Stabler St
- 5026 Delray Dr Unit A
- 4317 S Cedar St
- 4114 Burchfield Dr
- 129 Village Dr
- 4004 Lowcroft Ave
- 522 E Cavanaugh Rd
- 0 W Jolly Rd