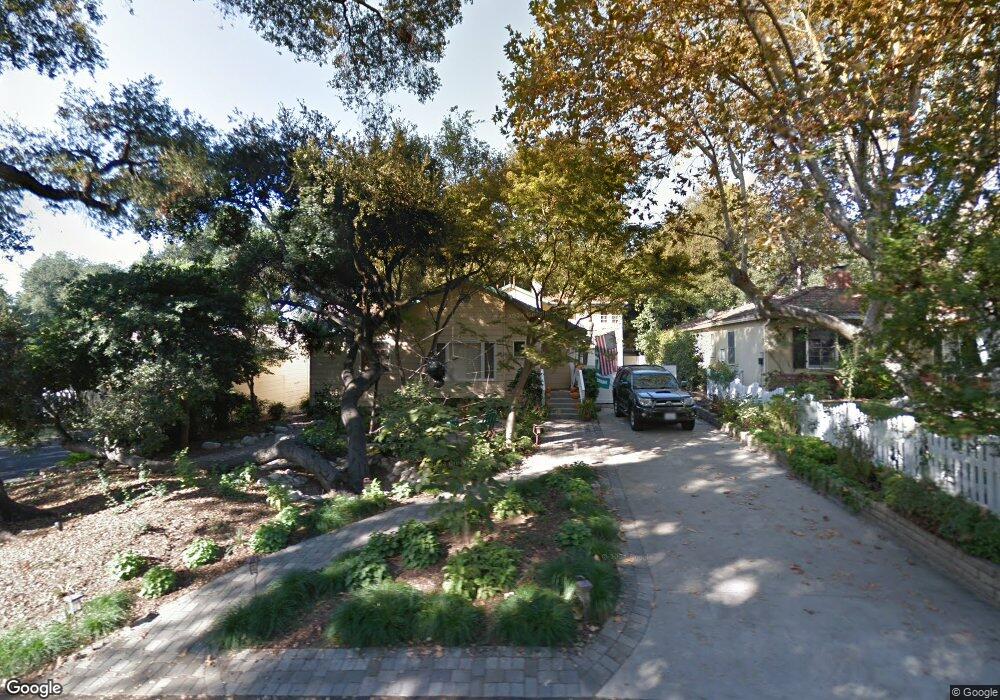
4917 Del Monte Rd La Canada Flintridge, CA 91011
Estimated Value: $2,212,000 - $2,705,000
3
Beds
3
Baths
2,864
Sq Ft
$854/Sq Ft
Est. Value
About This Home
This home is located at 4917 Del Monte Rd, La Canada Flintridge, CA 91011 and is currently estimated at $2,447,137, approximately $854 per square foot. 4917 Del Monte Rd is a home located in Los Angeles County with nearby schools including Paradise Canyon Elementary School, La Canada High School, and La Canada Preparatory School.
Ownership History
Date
Name
Owned For
Owner Type
Purchase Details
Closed on
Aug 24, 2009
Sold by
Prendergast James
Bought by
Lhotka Gregory S and Lhotka Heather C
Current Estimated Value
Home Financials for this Owner
Home Financials are based on the most recent Mortgage that was taken out on this home.
Original Mortgage
$1,000,000
Outstanding Balance
$651,673
Interest Rate
5.2%
Mortgage Type
Purchase Money Mortgage
Estimated Equity
$1,795,464
Purchase Details
Closed on
Feb 14, 2002
Sold by
Prendergast Robin Mccaffery
Bought by
Prendergast James
Purchase Details
Closed on
Aug 17, 1994
Sold by
Mccaffery Maryann and Mccaffery Family Trust
Bought by
Prendergast Robin Mccaffery
Purchase Details
Closed on
Aug 16, 1994
Sold by
Prendergast James David
Bought by
Prendergast Robin Mccaffery
Purchase Details
Closed on
Feb 1, 1994
Sold by
Prendergast James David
Bought by
Mccaffery James and Mccaffery Maryann
Create a Home Valuation Report for This Property
The Home Valuation Report is an in-depth analysis detailing your home's value as well as a comparison with similar homes in the area
Home Values in the Area
Average Home Value in this Area
Purchase History
| Date | Buyer | Sale Price | Title Company |
|---|---|---|---|
| Lhotka Gregory S | $1,120,000 | Fatcola | |
| Prendergast James | -- | First American Title Guarant | |
| Prendergast Robin Mccaffery | -- | -- | |
| Prendergast Robin Mccaffery | -- | -- | |
| Prendergast Robin Mccaffery | -- | -- | |
| Mccaffery James | $25,000 | -- |
Source: Public Records
Mortgage History
| Date | Status | Borrower | Loan Amount |
|---|---|---|---|
| Open | Lhotka Gregory S | $1,000,000 |
Source: Public Records
Tax History Compared to Growth
Tax History
| Year | Tax Paid | Tax Assessment Tax Assessment Total Assessment is a certain percentage of the fair market value that is determined by local assessors to be the total taxable value of land and additions on the property. | Land | Improvement |
|---|---|---|---|---|
| 2025 | $16,407 | $1,445,710 | $934,936 | $510,774 |
| 2024 | $16,407 | $1,417,363 | $916,604 | $500,759 |
| 2023 | $15,969 | $1,389,573 | $898,632 | $490,941 |
| 2022 | $15,387 | $1,362,327 | $881,012 | $481,315 |
| 2021 | $15,235 | $1,335,616 | $863,738 | $471,878 |
| 2019 | $14,771 | $1,296,003 | $838,120 | $457,883 |
| 2018 | $14,478 | $1,270,592 | $821,687 | $448,905 |
| 2016 | $14,523 | $1,221,255 | $789,781 | $431,474 |
| 2015 | $14,330 | $1,202,911 | $777,918 | $424,993 |
| 2014 | $14,133 | $1,179,348 | $762,680 | $416,668 |
Source: Public Records
Map
Nearby Homes
- 4826 Indianola Way
- 4537 Indianola Way
- 5311 Pali Point Ln
- 5213 Diamond Point Rd
- 4544 Daleridge Rd
- 4428 Oakwood Ave
- 500 Georgian Rd
- 5419 Godbey Dr
- 5117 Stoneglen Rd
- 4257 Chula Senda Ln
- 909 Coral Way
- 4825 Angeles Crest Hwy
- 4304 Chevy Chase Dr
- 4901 Angeles Crest Cir
- 4308 Hayman Ave
- 1237 Descanso Dr
- 4031 Canyon Dell Dr
- 5148 Angeles Crest Hwy
- 563 Highland Dr
- 3914 Alta Vista Dr
- 4911 Del Monte Rd
- 4927 Del Monte Rd
- 4844 Hampton Rd
- 4905 Del Monte Rd
- 4840 Hampton Rd
- 4848 Hampton Rd
- 4834 Hampton Rd
- 4931 Del Monte Rd
- 4854 Hampton Rd
- 4916 Del Monte Rd
- 4910 Del Monte Rd
- 4922 Del Monte Rd
- 4881 Del Monte Rd
- 4828 Hampton Rd
- 4935 Del Monte Rd
- 4928 Del Monte Rd
- 4904 Del Monte Rd
- 4904 Hampton Rd
- 4861 Del Monte Rd
- 4824 Hampton Rd