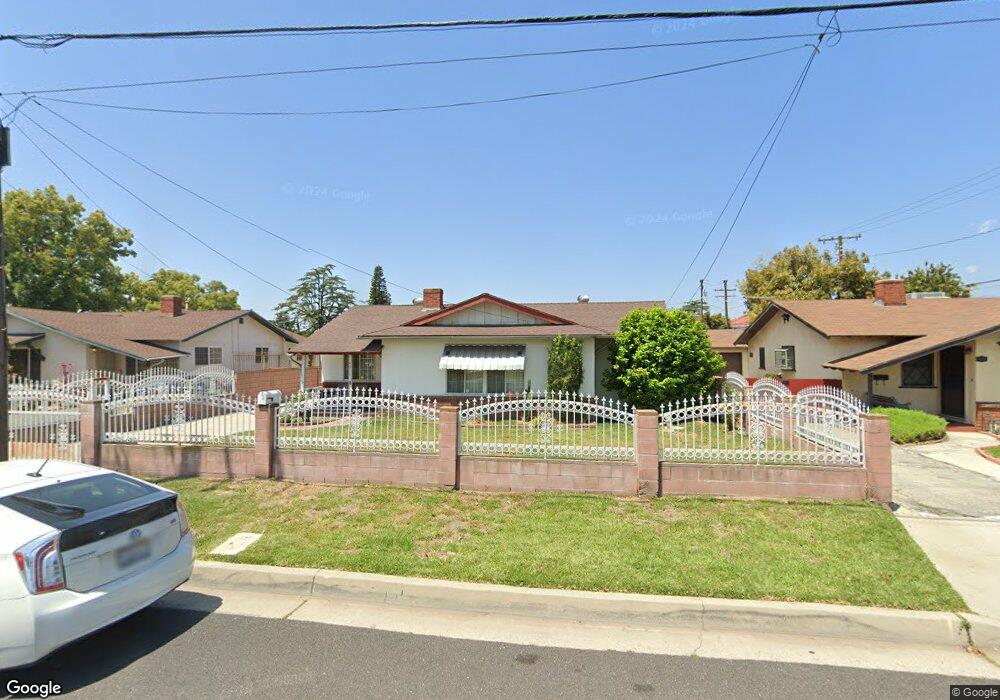
4917 La Madera Ave El Monte, CA 91732
Norwood Cherrylee NeighborhoodEstimated Value: $735,303 - $803,000
3
Beds
2
Baths
1,201
Sq Ft
$642/Sq Ft
Est. Value
About This Home
This home is located at 4917 La Madera Ave, El Monte, CA 91732 and is currently estimated at $770,576, approximately $641 per square foot. 4917 La Madera Ave is a home located in Los Angeles County with nearby schools including Cherrylee Elementary School, Durfee School, and Arroyo High School.
Ownership History
Date
Name
Owned For
Owner Type
Purchase Details
Closed on
Feb 15, 2018
Sold by
Liang Wei Ming
Bought by
Liang Wei Ming and Xie Qiao Zhen
Current Estimated Value
Home Financials for this Owner
Home Financials are based on the most recent Mortgage that was taken out on this home.
Original Mortgage
$250,000
Outstanding Balance
$213,865
Interest Rate
4.4%
Mortgage Type
Credit Line Revolving
Estimated Equity
$556,711
Purchase Details
Closed on
Oct 5, 2001
Sold by
Liang Wei Ming and Xie Qiad Zhen
Bought by
Liang Wei Ming
Home Financials for this Owner
Home Financials are based on the most recent Mortgage that was taken out on this home.
Original Mortgage
$88,000
Interest Rate
6.63%
Purchase Details
Closed on
Sep 1, 1998
Sold by
Luo Rui Chan and Liang Wei Ming
Bought by
Liang Wei Ming
Purchase Details
Closed on
Mar 7, 1995
Sold by
Xie Amy Qiao
Bought by
Luo Rui Chan
Purchase Details
Closed on
Feb 21, 1995
Sold by
Liang Rong Zhang
Bought by
Luo Rui Chan
Create a Home Valuation Report for This Property
The Home Valuation Report is an in-depth analysis detailing your home's value as well as a comparison with similar homes in the area
Home Values in the Area
Average Home Value in this Area
Purchase History
| Date | Buyer | Sale Price | Title Company |
|---|---|---|---|
| Liang Wei Ming | -- | Lawyers Title Company | |
| Liang Wei Ming | -- | Fidelity Title | |
| Liang Wei Ming | -- | Chicago Title | |
| Luo Rui Chan | -- | -- | |
| Luo Rui Chan | -- | -- |
Source: Public Records
Mortgage History
| Date | Status | Borrower | Loan Amount |
|---|---|---|---|
| Open | Liang Wei Ming | $250,000 | |
| Closed | Liang Wei Ming | $88,000 |
Source: Public Records
Tax History Compared to Growth
Tax History
| Year | Tax Paid | Tax Assessment Tax Assessment Total Assessment is a certain percentage of the fair market value that is determined by local assessors to be the total taxable value of land and additions on the property. | Land | Improvement |
|---|---|---|---|---|
| 2025 | $3,372 | $224,315 | $114,117 | $110,198 |
| 2024 | $3,372 | $219,918 | $111,880 | $108,038 |
| 2023 | $3,306 | $215,607 | $109,687 | $105,920 |
| 2022 | $3,190 | $211,381 | $107,537 | $103,844 |
| 2021 | $3,220 | $207,237 | $105,429 | $101,808 |
| 2019 | $3,272 | $201,092 | $102,302 | $98,790 |
| 2018 | $3,111 | $197,150 | $100,297 | $96,853 |
| 2016 | $2,979 | $189,496 | $96,403 | $93,093 |
| 2015 | $2,943 | $186,650 | $94,955 | $91,695 |
| 2014 | $2,837 | $182,994 | $93,095 | $89,899 |
Source: Public Records
Map
Nearby Homes
- 11946 Fairview St
- 5082 La Madera Ave
- 4739 Helmgate Dr
- 4734 Helmgate Dr
- 11654 Roseglen St
- 11639 Hallwood Dr
- 12132 Roseglen St
- 4849 Peck Rd Unit 36
- 4849 Peck Rd Unit 39
- 4849 Peck Rd Unit 67
- 4849 Peck Rd Unit 77
- 4849 Peck Rd Unit 48
- 12066 Celine St
- 11537 Ranchito St
- 5319 Durfee Ave
- 5320 Peck Rd Unit 49
- 4454 Cogswell Rd
- 5343 Peck Rd Unit D
- 4501 Peck Rd Unit 43
- 11328 Elmcrest St
- 4911 La Madera Ave
- 4923 La Madera Ave
- 4929 La Madera Ave
- 4907 La Madera Ave
- 4931 La Madera Ave
- 4937 La Madera Ave
- 4918 La Madera Ave
- 4904 La Madera Ave
- 4924 La Madera Ave
- 4912 La Madera Ave
- 4930 La Madera Ave
- 4939 La Madera Ave
- 11913 Roseglen St
- 4933 La Madera Ave
- 5003 La Madera Ave
- 5001 La Madera Ave
- 11850 Roseglen St
- 5005 La Madera Ave
- 11842 Roseglen St
- 11917 Roseglen St Unit STT