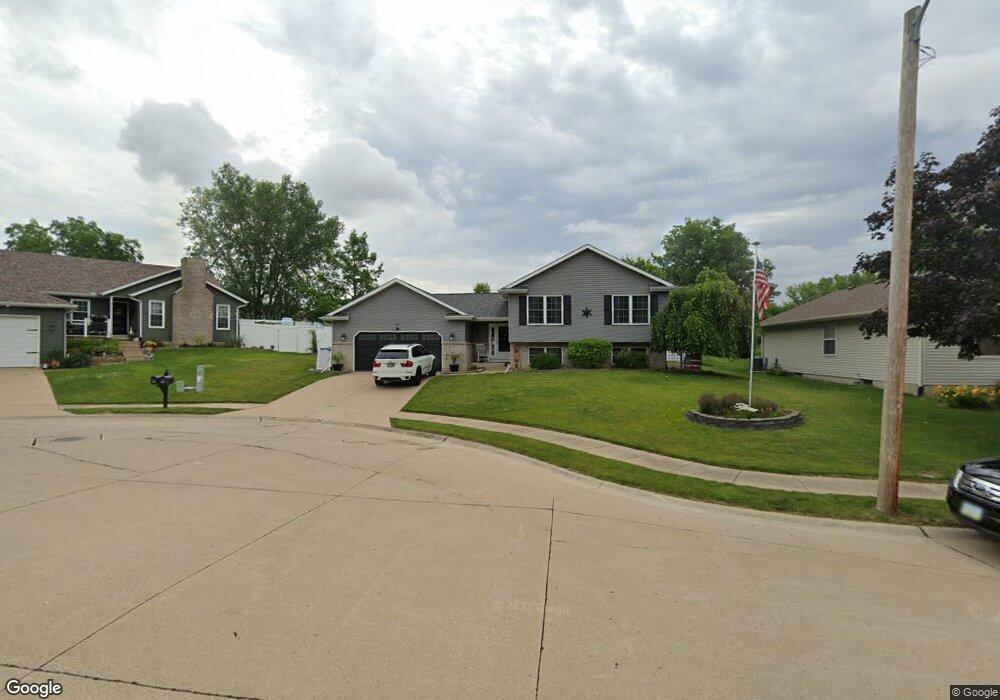
4917 Main Ct Davenport, IA 52806
North Side NeighborhoodEstimated Value: $278,000 - $326,108
4
Beds
3
Baths
1,356
Sq Ft
$221/Sq Ft
Est. Value
About This Home
This home is located at 4917 Main Ct, Davenport, IA 52806 and is currently estimated at $299,527, approximately $220 per square foot. 4917 Main Ct is a home located in Scott County with nearby schools including Cumberland Hall School, Harrison Elementary School, and Academy Of Continuing Education.
Ownership History
Date
Name
Owned For
Owner Type
Purchase Details
Closed on
Mar 28, 2011
Sold by
Hawley Todd H and Hawley Melissa A
Bought by
Hausman Robert Allen
Current Estimated Value
Home Financials for this Owner
Home Financials are based on the most recent Mortgage that was taken out on this home.
Original Mortgage
$200,214
Outstanding Balance
$139,495
Interest Rate
5.09%
Mortgage Type
VA
Estimated Equity
$160,032
Purchase Details
Closed on
May 18, 2007
Sold by
Knutsen Tod L and Knutsen Molly K
Bought by
Hawley Todd H and Hawley Melissa A
Create a Home Valuation Report for This Property
The Home Valuation Report is an in-depth analysis detailing your home's value as well as a comparison with similar homes in the area
Home Values in the Area
Average Home Value in this Area
Purchase History
| Date | Buyer | Sale Price | Title Company |
|---|---|---|---|
| Hausman Robert Allen | $196,000 | None Available | |
| Hawley Todd H | $187,000 | None Available |
Source: Public Records
Mortgage History
| Date | Status | Borrower | Loan Amount |
|---|---|---|---|
| Open | Hausman Robert Allen | $200,214 |
Source: Public Records
Tax History Compared to Growth
Tax History
| Year | Tax Paid | Tax Assessment Tax Assessment Total Assessment is a certain percentage of the fair market value that is determined by local assessors to be the total taxable value of land and additions on the property. | Land | Improvement |
|---|---|---|---|---|
| 2025 | $4,852 | $319,420 | $41,760 | $277,660 |
| 2024 | $5,240 | $290,190 | $41,760 | $248,430 |
| 2023 | $5,621 | $290,190 | $41,760 | $248,430 |
| 2022 | $5,270 | $265,710 | $41,760 | $223,950 |
| 2021 | $5,270 | $257,990 | $41,760 | $216,230 |
| 2020 | $5,273 | $234,820 | $41,760 | $193,060 |
| 2019 | $271 | $213,580 | $41,760 | $171,820 |
| 2018 | $611 | $213,580 | $41,760 | $171,820 |
| 2017 | $1,119 | $204,540 | $41,760 | $162,780 |
| 2016 | $4,311 | $204,540 | $0 | $0 |
| 2015 | $4,216 | $197,840 | $0 | $0 |
| 2014 | $4,126 | $197,840 | $0 | $0 |
| 2013 | $4,050 | $0 | $0 | $0 |
| 2012 | -- | $188,540 | $45,170 | $143,370 |
Source: Public Records
Map
Nearby Homes
- 4717 N Harrison St
- 315 Colony Dr
- 611 Northbrook Dr
- 4610 N Ripley St
- 710 Northbrook Dr
- 405 Westerfield Rd
- 4505 Sheridan St
- 4942 Brown St
- 825 Northbrook Dr
- 7 Vista Ct
- 4804 Northwest Blvd
- 4612 Warren St Unit 5
- 4449 Royal Oaks Dr
- 4757 Willow Cir
- 4743 Willow Cir
- 6127 Fair Ave
- 6205 N Ripley St
- 1005 W 58th St
- 6209 Fair Ave
- 6109 N Brady St
- 4911 Main Ct
- 4929 Main Ct
- 208 Northbrook Ct
- 4903 Main Ct
- 4920 Main Ct
- 4930 Main Ct
- 4918 Main Ct
- 206 Northbrook Ct
- 4912 Main Ct
- 204 Northbrook Ct
- 4904 Main Ct
- 235 Northbrook Ct
- 232 Northbrook Ct
- 231 Northbrook Ct
- 4927 N Harrison St
- 4904 N Main St
- 4917 N Harrison St
- 5003 N Harrison St
- 4911 N Harrison St
- 5011 N Harrison St