Estimated Value: $805,000 - $1,009,000
3
Beds
3
Baths
2,700
Sq Ft
$333/Sq Ft
Est. Value
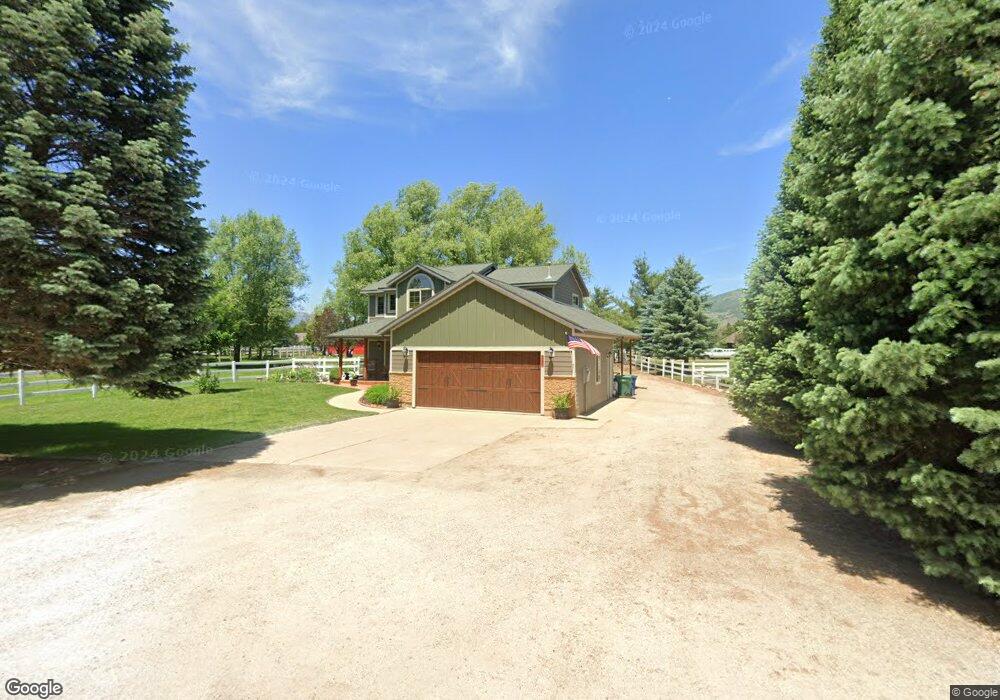
About This Home
This home is located at 4918 E 2725 N, Eden, UT 84310 and is currently estimated at $899,517, approximately $333 per square foot. 4918 E 2725 N is a home located in Weber County with nearby schools including Valley Elementary School, Snowcrest Junior High School, and Weber High School.
Ownership History
Date
Name
Owned For
Owner Type
Purchase Details
Closed on
Oct 29, 2018
Sold by
Borchert David A
Bought by
Burchert David A and Burchert Elizabeth A
Current Estimated Value
Purchase Details
Closed on
Aug 29, 2001
Sold by
Borchert David A
Bought by
Borchert David A and Borchert Elizabeth A
Home Financials for this Owner
Home Financials are based on the most recent Mortgage that was taken out on this home.
Original Mortgage
$233,900
Interest Rate
7.09%
Purchase Details
Closed on
Oct 24, 1996
Sold by
Farr Jaqueline and Farr Gordon W
Bought by
Erickson Von Dell
Home Financials for this Owner
Home Financials are based on the most recent Mortgage that was taken out on this home.
Original Mortgage
$115,000
Interest Rate
8.11%
Create a Home Valuation Report for This Property
The Home Valuation Report is an in-depth analysis detailing your home's value as well as a comparison with similar homes in the area
Home Values in the Area
Average Home Value in this Area
Purchase History
| Date | Buyer | Sale Price | Title Company |
|---|---|---|---|
| Burchert David A | -- | None Available | |
| Borchert David A | -- | Mountain View Title | |
| Borchert David A | -- | -- | |
| Erickson Von Dell | -- | Associated Title |
Source: Public Records
Mortgage History
| Date | Status | Borrower | Loan Amount |
|---|---|---|---|
| Previous Owner | Borchert David A | $233,900 | |
| Previous Owner | Erickson Von Dell | $115,000 | |
| Closed | Erickson Von Dell | $25,000 |
Source: Public Records
Tax History
| Year | Tax Paid | Tax Assessment Tax Assessment Total Assessment is a certain percentage of the fair market value that is determined by local assessors to be the total taxable value of land and additions on the property. | Land | Improvement |
|---|---|---|---|---|
| 2025 | $220 | $775,736 | $258,412 | $517,324 |
| 2024 | $125 | $399,676 | $133,863 | $265,813 |
| 2023 | $145 | $362,933 | $131,135 | $231,798 |
| 2022 | $1,281 | $354,515 | $114,604 | $239,911 |
| 2021 | $435 | $465,288 | $138,353 | $326,935 |
| 2020 | $107 | $380,999 | $100,596 | $280,403 |
| 2019 | $135 | $374,002 | $97,584 | $276,418 |
| 2018 | $106 | $323,489 | $97,584 | $225,905 |
| 2017 | $150 | $318,000 | $88,370 | $229,630 |
| 2016 | $163 | $179,434 | $46,342 | $133,092 |
| 2015 | $95 | $144,659 | $44,008 | $100,651 |
| 2014 | $96 | $131,510 | $41,594 | $89,916 |
Source: Public Records
Map
Nearby Homes
- 2773 N Wolf Creek Dr
- 3098 N 5100 E
- 3480 N 5100 E
- 3510 N Willow Creek Ln Unit 9
- 5347 E 3450 N Unit 1003
- 5345 E 3450 N Unit 1004
- 5293 E 3425 N Unit 804
- 5338 E 3425 N Unit 1001
- 5217 E Moose Hollow Dr Unit 303
- 3521 N Fox Run Dr Unit 808
- 5060 E Lakeview Dr Unit 1109
- 3543 N Creekside Way
- 3518 Moosehollow Dr
- 3518 Moosehollow Dr Unit 1411
- 3518 Moosehollow Dr Unit 1402
- 3562 N Fox Run Dr Unit 406
- 3555 N Fox Run Dr Unit 304
- 3555 N Fox Run Dr Unit 303
- 5122 Moosehollow Dr Unit 205
- 3615 N Wolf Lodge Dr Unit 709
- 4942 E 2725 N
- 4925 E 2725 N
- 4898 E 2725 N
- 4917 E 2775 N
- 4917 E 2775 N Unit 21
- 4901 E 2725 N
- 4945 E 2725 N
- 4962 E 2725 N
- 4983 E 2725 N
- 4945 E 2775 N
- 4879 E 2725 N
- 4879 E 2725 N Unit 15
- 4876 E 2725 N
- 4876 E 2725 N Unit 2
- 4891 E 2775 N
- 4990 E 2725 N
- 4950 E 2725 N
- 4863 E 2775 N
- 2725 N 4950 E
- 2668 N Highway 162
Your Personal Tour Guide
Ask me questions while you tour the home.