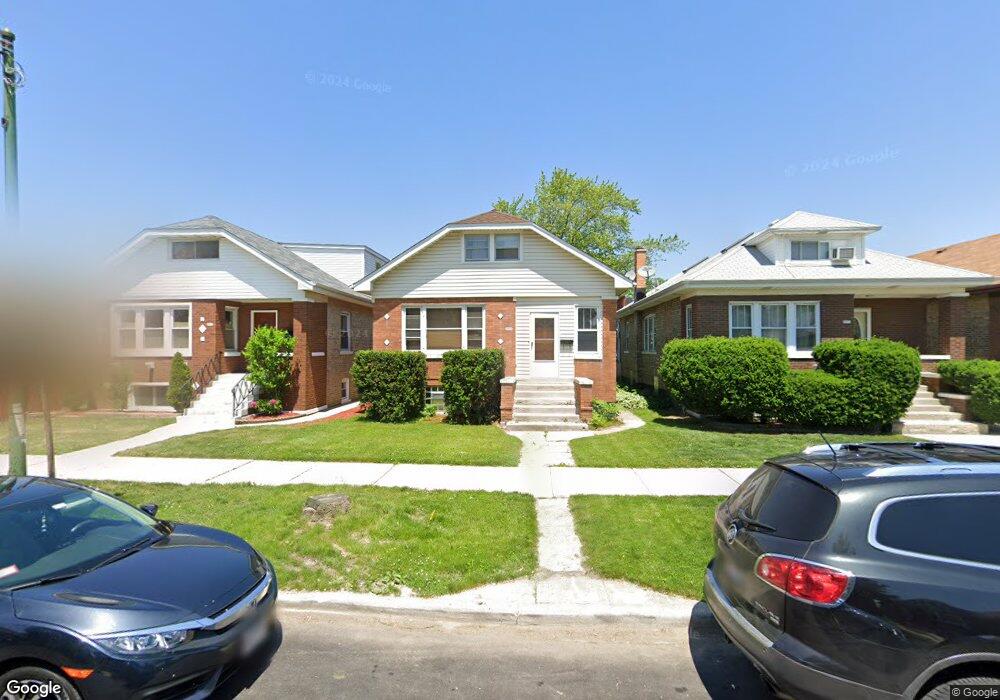
4918 W Newport Ave Chicago, IL 60641
Portage Park NeighborhoodEstimated Value: $390,000 - $467,940
3
Beds
3
Baths
2,082
Sq Ft
$203/Sq Ft
Est. Value
About This Home
This home is located at 4918 W Newport Ave, Chicago, IL 60641 and is currently estimated at $423,485, approximately $203 per square foot. 4918 W Newport Ave is a home located in Cook County with nearby schools including Falconer Elementary School, Foreman College and Career Academy, and Kelvyn Park High School.
Ownership History
Date
Name
Owned For
Owner Type
Purchase Details
Closed on
Nov 6, 2020
Sold by
Harless Robert E and Barstow Heather L
Bought by
Barstow Heather L and Harless Robert E
Current Estimated Value
Purchase Details
Closed on
Jun 28, 2004
Sold by
Niedzielak Andrzej and Niedzielak Anna
Bought by
Harless Robert E and Barstow Heather L
Home Financials for this Owner
Home Financials are based on the most recent Mortgage that was taken out on this home.
Original Mortgage
$159,000
Interest Rate
6.37%
Mortgage Type
Unknown
Purchase Details
Closed on
Jul 11, 1995
Sold by
Dickson Alfred G and Dickson Rose A
Bought by
Niedzielak Andrzej and Niedzielak Anna
Home Financials for this Owner
Home Financials are based on the most recent Mortgage that was taken out on this home.
Original Mortgage
$95,200
Interest Rate
7.79%
Create a Home Valuation Report for This Property
The Home Valuation Report is an in-depth analysis detailing your home's value as well as a comparison with similar homes in the area
Home Values in the Area
Average Home Value in this Area
Purchase History
| Date | Buyer | Sale Price | Title Company |
|---|---|---|---|
| Barstow Heather L | $147,500 | First American Title | |
| Harless Robert E | $279,000 | Atgf Inc | |
| Niedzielak Andrzej | $178,500 | First American Title |
Source: Public Records
Mortgage History
| Date | Status | Borrower | Loan Amount |
|---|---|---|---|
| Previous Owner | Harless Robert E | $159,000 | |
| Previous Owner | Niedzielak Andrzej | $95,200 |
Source: Public Records
Tax History Compared to Growth
Tax History
| Year | Tax Paid | Tax Assessment Tax Assessment Total Assessment is a certain percentage of the fair market value that is determined by local assessors to be the total taxable value of land and additions on the property. | Land | Improvement |
|---|---|---|---|---|
| 2024 | $4,578 | $35,545 | $12,788 | $22,757 |
| 2023 | $4,441 | $25,001 | $10,313 | $14,688 |
| 2022 | $4,441 | $25,001 | $10,313 | $14,688 |
| 2021 | $4,360 | $24,999 | $10,312 | $14,687 |
| 2020 | $4,600 | $23,741 | $5,981 | $17,760 |
| 2019 | $4,673 | $26,676 | $5,981 | $20,695 |
| 2018 | $4,594 | $26,676 | $5,981 | $20,695 |
| 2017 | $5,406 | $28,476 | $5,362 | $23,114 |
| 2016 | $5,206 | $28,476 | $5,362 | $23,114 |
| 2015 | $4,740 | $28,476 | $5,362 | $23,114 |
| 2014 | $4,304 | $25,749 | $4,950 | $20,799 |
| 2013 | $4,208 | $25,749 | $4,950 | $20,799 |
Source: Public Records
Map
Nearby Homes
- 4848 W Eddy St
- 5002 W Newport Ave Unit 1
- 5015 W Cornelia Ave
- 4831 W Roscoe St
- 4834 W Henderson St Unit 1B
- 5057 W Roscoe St Unit 2
- 2613-2633 N Cicero Ave
- 2841-49 N Cicero Ave
- 5121 W Newport Ave
- 4718 W Addison St
- 4840 W Waveland Ave
- 5121 W Henderson St
- 3443 N Kilpatrick Ave
- 5155 W Roscoe St
- 4721 W Warwick Ave
- 5221 W Cornelia Ave
- 5000 W Grace St
- 5026 W Fletcher St
- 3415 N Kenton Ave
- 3658 N Laramie Ave
- 4914 W Newport Ave
- 4920 W Newport Ave
- 4924 W Newport Ave
- 4910 W Newport Ave
- 4908 W Newport Ave
- 4908 W Newport Ave
- 4926 W Newport Ave
- 4930 W Newport Ave
- 4919 W Cornelia Ave
- 4904 W Newport Ave
- 4915 W Cornelia Ave
- 4921 W Cornelia Ave
- 4909 W Cornelia Ave
- 4911 W Cornelia Ave
- 4934 W Newport Ave
- 4900 W Newport Ave
- 4927 W Cornelia Ave
- 4919 W Newport Ave
- 4905 W Cornelia Ave
- 4921 W Newport Ave