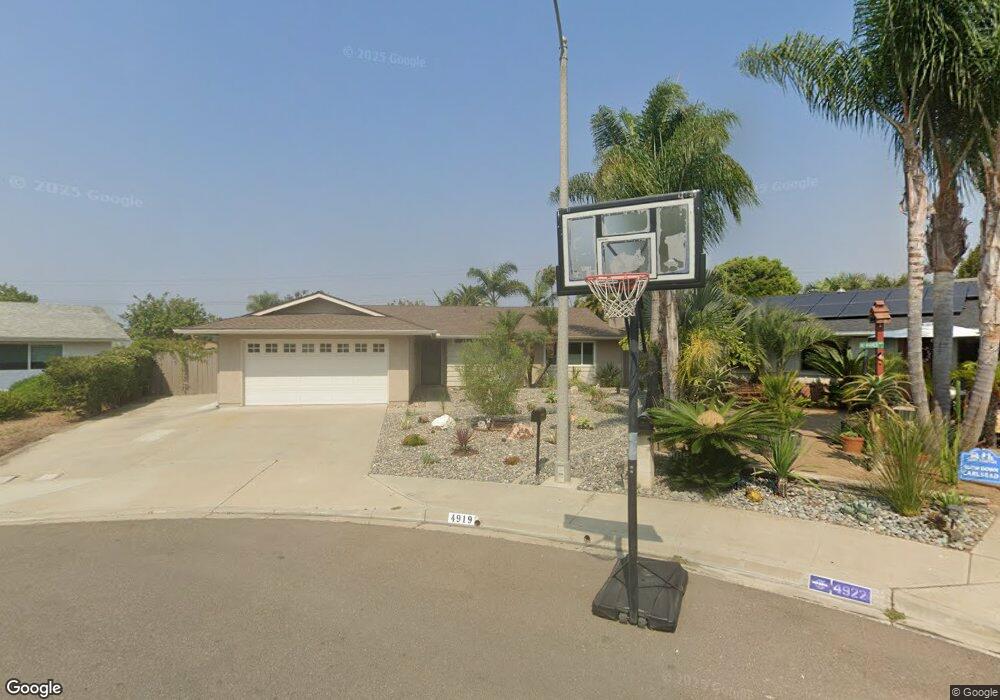
4919 Loma Way Carlsbad, CA 92008
Hedionda Point NeighborhoodEstimated Value: $1,129,635 - $1,511,000
4
Beds
2
Baths
1,421
Sq Ft
$981/Sq Ft
Est. Value
About This Home
This home is located at 4919 Loma Way, Carlsbad, CA 92008 and is currently estimated at $1,393,409, approximately $980 per square foot. 4919 Loma Way is a home located in San Diego County with nearby schools including Kelly Elementary School, Carlsbad High School, and Sage Creek High.
Ownership History
Date
Name
Owned For
Owner Type
Purchase Details
Closed on
Aug 12, 2003
Sold by
Trousset Tracy M
Bought by
Trousset Tracy M
Current Estimated Value
Home Financials for this Owner
Home Financials are based on the most recent Mortgage that was taken out on this home.
Original Mortgage
$115,000
Interest Rate
4.65%
Mortgage Type
Purchase Money Mortgage
Purchase Details
Closed on
Aug 11, 2003
Sold by
Trousset Tracy
Bought by
Trousset Tracy M
Home Financials for this Owner
Home Financials are based on the most recent Mortgage that was taken out on this home.
Original Mortgage
$115,000
Interest Rate
4.65%
Mortgage Type
Purchase Money Mortgage
Purchase Details
Closed on
Nov 22, 2002
Sold by
Trousset Tracy
Bought by
Trousset Tracy
Purchase Details
Closed on
Mar 15, 2001
Sold by
Trousset Anthony and Trousset Tracy Marie
Bought by
Trousset Tracy
Create a Home Valuation Report for This Property
The Home Valuation Report is an in-depth analysis detailing your home's value as well as a comparison with similar homes in the area
Home Values in the Area
Average Home Value in this Area
Purchase History
| Date | Buyer | Sale Price | Title Company |
|---|---|---|---|
| Trousset Tracy M | -- | Commonwealth Land Title Co | |
| Trousset Tracy M | -- | Commonwealth Land Title Co | |
| Trousset Tracy | -- | -- | |
| Trousset Tracy | -- | -- |
Source: Public Records
Mortgage History
| Date | Status | Borrower | Loan Amount |
|---|---|---|---|
| Closed | Trousset Tracy M | $115,000 |
Source: Public Records
Tax History Compared to Growth
Tax History
| Year | Tax Paid | Tax Assessment Tax Assessment Total Assessment is a certain percentage of the fair market value that is determined by local assessors to be the total taxable value of land and additions on the property. | Land | Improvement |
|---|---|---|---|---|
| 2025 | $922 | $78,363 | $25,610 | $52,753 |
| 2024 | $922 | $76,827 | $25,108 | $51,719 |
| 2023 | $916 | $75,321 | $24,616 | $50,705 |
| 2022 | $903 | $73,845 | $24,134 | $49,711 |
| 2021 | $897 | $72,398 | $23,661 | $48,737 |
| 2020 | $891 | $71,657 | $23,419 | $48,238 |
| 2019 | $877 | $70,253 | $22,960 | $47,293 |
| 2018 | $844 | $68,876 | $22,510 | $46,366 |
| 2017 | $831 | $67,526 | $22,069 | $45,457 |
| 2016 | $799 | $66,203 | $21,637 | $44,566 |
| 2015 | $796 | $65,209 | $21,312 | $43,897 |
| 2014 | $786 | $63,933 | $20,895 | $43,038 |
Source: Public Records
Map
Nearby Homes
- 0 Park Dr
- 2513 Delphinium Ln
- 2508 Chamomile Ln
- 4564 Catmint Ln
- 4700 Parsley Ln
- 4906 Via Hinton
- 4806 Parsley Ln
- Plan 1688 Modeled at Coral Ridge
- Plan 1732 Modeled at Coral Ridge
- Plan 1739 Modeled at Coral Ridge
- 2536 Elderberry Ln
- 2524 Chamomile Ln
- 2579 Elderberry Ln
- 2545 Broom Ln
- 2548 Chamomile Ln
- 2555 Elderberry Ln
- 2572 Elderberry Ln
- 2524 Elderberry Ln
- 2572 Chamomile Ln
- 2564 Chamomile Ln