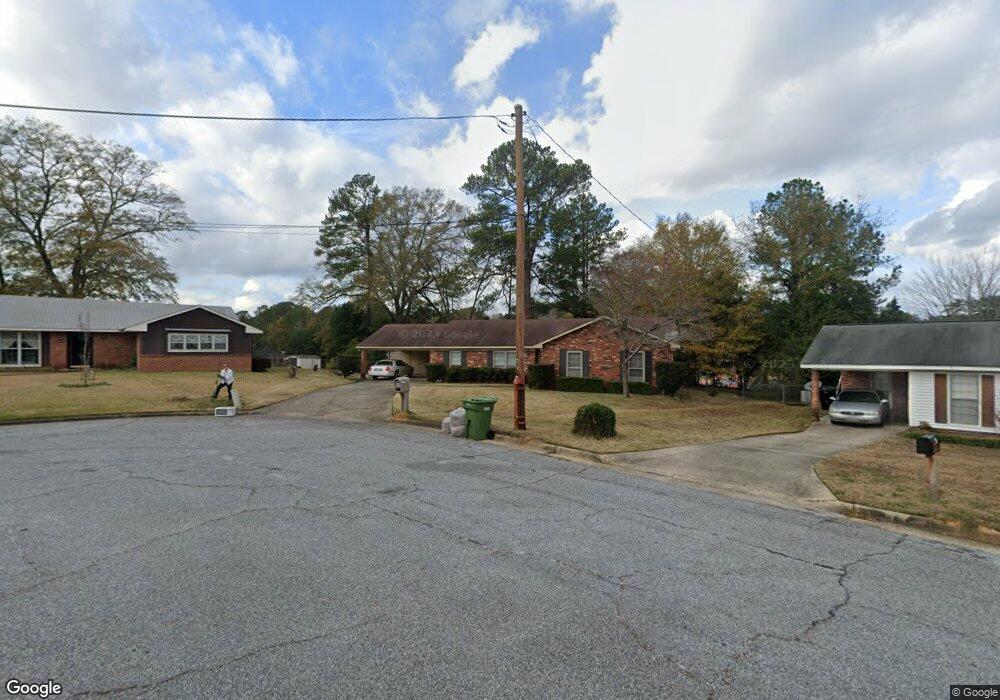
4919 Roxbury Ct Columbus, GA 31907
Eastern Columbus NeighborhoodEstimated Value: $219,000 - $241,052
4
Beds
3
Baths
1,960
Sq Ft
$119/Sq Ft
Est. Value
About This Home
This home is located at 4919 Roxbury Ct, Columbus, GA 31907 and is currently estimated at $232,263, approximately $118 per square foot. 4919 Roxbury Ct is a home located in Muscogee County with nearby schools including Reese Road Leadership Academy, Fort Middle School, and Hardaway High School.
Ownership History
Date
Name
Owned For
Owner Type
Purchase Details
Closed on
Jun 9, 2023
Sold by
Voynich Sarah Ruth
Bought by
Mailman Jason Matthew and Hilliard Jazmin
Current Estimated Value
Home Financials for this Owner
Home Financials are based on the most recent Mortgage that was taken out on this home.
Original Mortgage
$183,825
Outstanding Balance
$178,945
Interest Rate
6.43%
Mortgage Type
New Conventional
Estimated Equity
$53,318
Purchase Details
Closed on
Jun 2, 2023
Sold by
Hellkamp Lori Anna
Bought by
Mailman Jason Matthew and Hilliard Jazmin
Home Financials for this Owner
Home Financials are based on the most recent Mortgage that was taken out on this home.
Original Mortgage
$183,825
Outstanding Balance
$178,945
Interest Rate
6.43%
Mortgage Type
New Conventional
Estimated Equity
$53,318
Purchase Details
Closed on
May 22, 2019
Sold by
Hellkamp Lawrence Edward
Bought by
Hellkamp Rita Victoria
Create a Home Valuation Report for This Property
The Home Valuation Report is an in-depth analysis detailing your home's value as well as a comparison with similar homes in the area
Home Values in the Area
Average Home Value in this Area
Purchase History
| Date | Buyer | Sale Price | Title Company |
|---|---|---|---|
| Mailman Jason Matthew | $64,500 | None Listed On Document | |
| Mailman Jason Matthew | $64,500 | None Listed On Document | |
| Mailman Jason Matthew | $64,500 | None Listed On Document | |
| Hellkamp Rita Victoria | -- | -- |
Source: Public Records
Mortgage History
| Date | Status | Borrower | Loan Amount |
|---|---|---|---|
| Open | Mailman Jason Matthew | $183,825 |
Source: Public Records
Tax History Compared to Growth
Tax History
| Year | Tax Paid | Tax Assessment Tax Assessment Total Assessment is a certain percentage of the fair market value that is determined by local assessors to be the total taxable value of land and additions on the property. | Land | Improvement |
|---|---|---|---|---|
| 2025 | $2,495 | $76,912 | $9,452 | $67,460 |
| 2024 | $2,493 | $76,912 | $9,452 | $67,460 |
| 2023 | $1,464 | $73,452 | $9,452 | $64,000 |
| 2022 | $2,236 | $59,136 | $9,452 | $49,684 |
| 2021 | $2,230 | $52,232 | $9,452 | $42,780 |
| 2020 | $2,230 | $52,232 | $9,452 | $42,780 |
| 2019 | $2,239 | $52,232 | $9,452 | $42,780 |
| 2018 | $2,239 | $52,232 | $9,452 | $42,780 |
| 2017 | $2,248 | $52,232 | $9,452 | $42,780 |
| 2016 | $2,258 | $68,000 | $6,210 | $61,790 |
| 2015 | $2,261 | $68,000 | $6,210 | $61,790 |
| 2014 | $2,264 | $68,000 | $6,210 | $61,790 |
| 2013 | -- | $68,000 | $6,210 | $61,790 |
Source: Public Records
Map
Nearby Homes
- 3053 Reese Rd
- 4732 Delfair Dr
- 2951 Florence Dr
- 3814 Pond View Ct
- 4635 Delfair Dr
- 2 Hidden Woods Ct
- 5031 Yosemite Dr
- 4120 Fairview Dr
- 2973 Grant Rd
- 4975 Glacier Dr
- 4355 Byron St
- 3521 Willow Bend Run
- 3409 Ambassador Dr
- 4317 Byron St
- 2879 Grant Rd
- 4524 Hedingham Ln
- 10 Conisburgh Ct
- 2871 Barbara Rd
- 5590 Macon Rd
- 2713 Hilyer Dr
- 4919 Roxbury Ct
- 4923 Roxbury Ct
- 4915 Roxbury Ct
- 4911 Roxbury Ct
- 3812 Reese Rd
- 4909 Roxbury Ct
- 3804 Reese Rd
- 4927 Roxbury Ct
- 4837 Roxbury Dr
- 4931 Roxbury Ct
- 3730 Reese Rd
- 4901 Roxbury Ct
- 4829 Roxbury Dr
- 4935 Roxbury Ct
- 4809 Delfair Dr
- 3019 Reese Rd
- 3023 Reese Rd
- 3722 Reese Rd
- 3027 Reese Rd
- 4939 Roxbury Ct