4919 Shallowbrook Trail Raleigh, NC 27616
Northeast Raleigh NeighborhoodEstimated Value: $549,000 - $1,185,196
--
Bed
4
Baths
4,578
Sq Ft
$198/Sq Ft
Est. Value
About This Home
This home is located at 4919 Shallowbrook Trail, Raleigh, NC 27616 and is currently estimated at $904,799, approximately $197 per square foot. 4919 Shallowbrook Trail is a home located in Wake County with nearby schools including River Bend Elementary, River Bend Middle, and Rolesville High School.
Ownership History
Date
Name
Owned For
Owner Type
Purchase Details
Closed on
Aug 24, 2005
Sold by
Brant H Paul and Brant Christine M
Bought by
Collier Douglas T and Collier April A
Current Estimated Value
Home Financials for this Owner
Home Financials are based on the most recent Mortgage that was taken out on this home.
Original Mortgage
$337,900
Outstanding Balance
$177,275
Interest Rate
5.64%
Mortgage Type
New Conventional
Estimated Equity
$727,524
Purchase Details
Closed on
Feb 1, 2000
Sold by
Oakley Floyd O and Oakley Shirley A
Bought by
Allen Michael K and Allen Paula F
Home Financials for this Owner
Home Financials are based on the most recent Mortgage that was taken out on this home.
Original Mortgage
$84,500
Interest Rate
8.02%
Purchase Details
Closed on
Aug 13, 1998
Sold by
Peterson Robert D
Bought by
Oakley Floyd O and Oakley Sherry A
Home Financials for this Owner
Home Financials are based on the most recent Mortgage that was taken out on this home.
Original Mortgage
$85,000
Interest Rate
6.97%
Create a Home Valuation Report for This Property
The Home Valuation Report is an in-depth analysis detailing your home's value as well as a comparison with similar homes in the area
Home Values in the Area
Average Home Value in this Area
Purchase History
| Date | Buyer | Sale Price | Title Company |
|---|---|---|---|
| Collier Douglas T | -- | None Available | |
| Allen Michael K | $130,000 | -- | |
| Oakley Floyd O | $80,000 | -- |
Source: Public Records
Mortgage History
| Date | Status | Borrower | Loan Amount |
|---|---|---|---|
| Open | Collier Douglas T | $337,900 | |
| Closed | Allen Michael K | $84,500 | |
| Previous Owner | Oakley Floyd O | $85,000 |
Source: Public Records
Tax History Compared to Growth
Tax History
| Year | Tax Paid | Tax Assessment Tax Assessment Total Assessment is a certain percentage of the fair market value that is determined by local assessors to be the total taxable value of land and additions on the property. | Land | Improvement |
|---|---|---|---|---|
| 2025 | $6,597 | $1,028,315 | $210,000 | $818,315 |
| 2024 | $6,406 | $1,028,315 | $210,000 | $818,315 |
| 2023 | $5,036 | $643,307 | $95,000 | $548,307 |
| 2022 | $4,666 | $643,307 | $95,000 | $548,307 |
| 2021 | $4,541 | $643,307 | $95,000 | $548,307 |
| 2020 | $4,465 | $643,307 | $95,000 | $548,307 |
| 2019 | $4,285 | $522,226 | $100,000 | $422,226 |
| 2018 | $3,939 | $522,226 | $100,000 | $422,226 |
| 2017 | $3,733 | $522,226 | $100,000 | $422,226 |
| 2016 | $3,657 | $522,226 | $100,000 | $422,226 |
| 2015 | $3,666 | $524,946 | $100,000 | $424,946 |
| 2014 | -- | $524,946 | $100,000 | $424,946 |
Source: Public Records
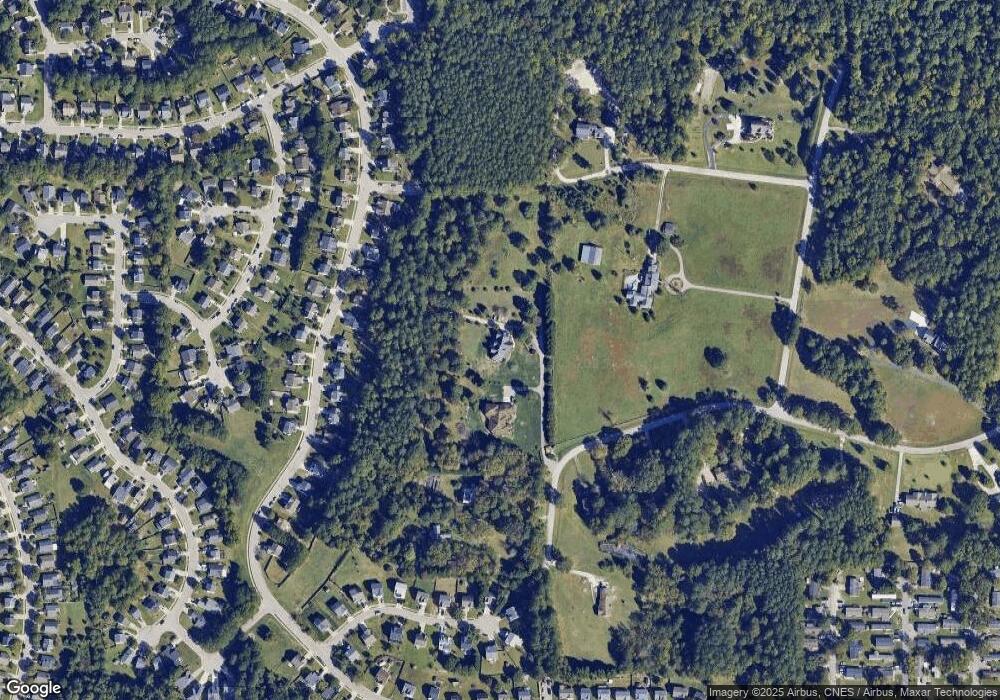
Map
Nearby Homes
- 5325 Marthonna Way
- 4800 Arbor Lodge Dr
- 5012 Silverdene St
- 5200 Fieldwood Ct
- 5915 River Landings Dr
- 5321 Glass Ridge Rd
- 4821 Heathshire Dr
- 5208 Windmere Chase Dr
- 4416 Walker Hallow St
- 4440 Cardinal Grove Blvd
- 6009 River Landings Dr
- 4508 Brintons Cottage St
- 4416 Brintons Cottage St
- 4809 Kaycee Ct
- 4348 Karlbrook Ln
- 4252 Rockdell Hall St
- 4236 Saubranch Hill St
- 6429 Pathfinder Way
- 4139 Davis Meadow St
- 5525 Buffaloe Rd
- 4911 Shallowbrook Trail
- 5204 Cardinal Grove Blvd
- 5208 Cardinal Grove Blvd
- 5200 Cardinal Grove Blvd
- 5060 Cardinal Grove Blvd
- 5212 Cardinal Grove Blvd
- 5112 Cardinal Grove Blvd
- 5216 Cardinal Grove Blvd
- 5108 Cardinal Grove Blvd
- 5104 Cardinal Grove Blvd
- 5220 Cardinal Grove Blvd
- 12417 Shallowbrook Trail
- 4901 Shallowbrook Trail
- 5100 Cardinal Grove Blvd
- 5001 Deer Creek Trail
- 5205 Cardinal Grove Blvd
- 5209 Cardinal Grove Blvd
- 5201 Cardinal Grove Blvd
- 5215 Cardinal Grove Blvd
- 5215 Cardinal Grove Blvd Unit 120