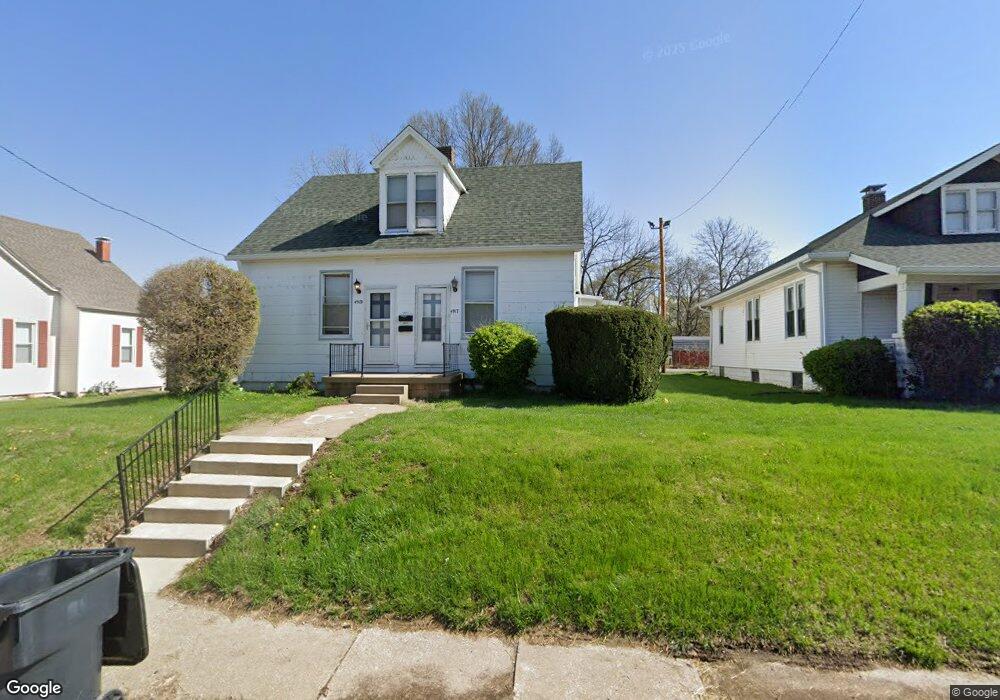
4919 W Main St Belleville, IL 62226
Estimated Value: $106,000 - $128,000
Studio
--
Bath
900
Sq Ft
$133/Sq Ft
Est. Value
About This Home
This home is located at 4919 W Main St, Belleville, IL 62226 and is currently estimated at $119,296, approximately $132 per square foot. 4919 W Main St is a home located in St. Clair County with nearby schools including Abraham Lincoln Elementary School, West Jr High School, and Our Lady Queen Of Peace Catholic School.
Ownership History
Date
Name
Owned For
Owner Type
Purchase Details
Closed on
Nov 7, 2006
Sold by
Haloftis David J
Bought by
Johnson Henry and Williams Johnson Sharon
Current Estimated Value
Home Financials for this Owner
Home Financials are based on the most recent Mortgage that was taken out on this home.
Original Mortgage
$67,900
Outstanding Balance
$48,895
Interest Rate
10.5%
Mortgage Type
Purchase Money Mortgage
Estimated Equity
$70,401
Purchase Details
Closed on
Sep 2, 2004
Sold by
Kohn Helen M and Owens Mary Mcclane
Bought by
Haloftis David J
Purchase Details
Closed on
Aug 28, 2002
Sold by
Owens Mary K and Kohn Helen M
Bought by
Mcclane Lonnie S and Owens Mary K
Create a Home Valuation Report for This Property
The Home Valuation Report is an in-depth analysis detailing your home's value as well as a comparison with similar homes in the area
Home Values in the Area
Average Home Value in this Area
Purchase History
| Date | Buyer | Sale Price | Title Company |
|---|---|---|---|
| Johnson Henry | $80,000 | First County Title | |
| Haloftis David J | $32,000 | First County Title | |
| Mcclane Lonnie S | -- | -- |
Source: Public Records
Mortgage History
| Date | Status | Borrower | Loan Amount |
|---|---|---|---|
| Open | Johnson Henry | $67,900 |
Source: Public Records
Tax History
| Year | Tax Paid | Tax Assessment Tax Assessment Total Assessment is a certain percentage of the fair market value that is determined by local assessors to be the total taxable value of land and additions on the property. | Land | Improvement |
|---|---|---|---|---|
| 2024 | $3,170 | $36,046 | $3,659 | $32,387 |
| 2023 | $2,259 | $24,067 | $3,587 | $20,480 |
| 2022 | $3,182 | $33,244 | $3,229 | $30,015 |
| 2021 | $3,200 | $32,094 | $2,985 | $29,109 |
| 2020 | $3,110 | $30,350 | $2,823 | $27,527 |
| 2019 | $2,686 | $25,930 | $2,828 | $23,102 |
| 2018 | $2,627 | $25,369 | $2,767 | $22,602 |
| 2017 | $2,689 | $25,994 | $2,747 | $23,247 |
| 2016 | $2,655 | $25,442 | $2,689 | $22,753 |
| 2014 | $2,553 | $27,605 | $3,024 | $24,581 |
| 2013 | $3,024 | $33,517 | $3,067 | $30,450 |
Source: Public Records
Map
Nearby Homes
- 5 Parkridge
- 4521 N Belt W
- 425 S 47th St
- 129 N 44th St
- 2264 Frank Scott Pkwy W
- 22 Kensington Heights Rd Unit 22 & 24
- 126 N 44th St
- 2241 Frank Scott Pkwy W
- 2245 Frank Scott Pkwy W
- 21 S 57th St
- 128 Freedom Dr
- 22 Elizabeth Dr
- 4119 Betty Dr
- 119 Freedom Dr
- 36 Berrywood Dr
- 112 Freedom Dr
- 4101 W Main St
- 400 Avery Hill
- 14 N 41st St
- 213 Springdale Dr
Your Personal Tour Guide
Ask me questions while you tour the home.