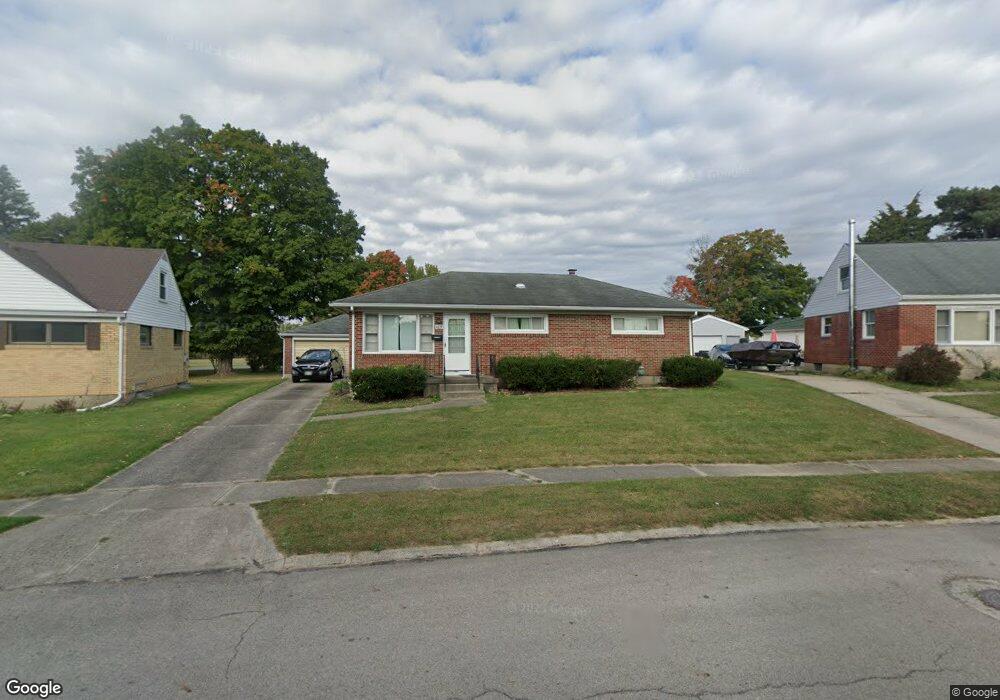
4919 Westmont Dr Springfield, OH 45503
Estimated Value: $54,000 - $198,000
3
Beds
1
Bath
1,075
Sq Ft
$138/Sq Ft
Est. Value
About This Home
This home is located at 4919 Westmont Dr, Springfield, OH 45503 and is currently estimated at $148,333, approximately $137 per square foot. 4919 Westmont Dr is a home located in Clark County with nearby schools including Rolling Hills Elementary School, Northridge Elementary School, and Northridge Middle School.
Ownership History
Date
Name
Owned For
Owner Type
Purchase Details
Closed on
Oct 18, 2024
Sold by
Lambert Sherri A
Bought by
Snr Rentals Llc
Current Estimated Value
Purchase Details
Closed on
Oct 16, 2024
Sold by
Baranski Tina and Baranski Curtis J
Bought by
Snr Rentals Llc
Purchase Details
Closed on
Oct 29, 2007
Sold by
Lambert Rita M
Bought by
Roush Nikki L and Lambert Sherri A
Create a Home Valuation Report for This Property
The Home Valuation Report is an in-depth analysis detailing your home's value as well as a comparison with similar homes in the area
Home Values in the Area
Average Home Value in this Area
Purchase History
| Date | Buyer | Sale Price | Title Company |
|---|---|---|---|
| Snr Rentals Llc | $60,000 | None Listed On Document | |
| Snr Rentals Llc | $50,000 | None Listed On Document | |
| Roush Nikki L | -- | Attorney |
Source: Public Records
Tax History Compared to Growth
Tax History
| Year | Tax Paid | Tax Assessment Tax Assessment Total Assessment is a certain percentage of the fair market value that is determined by local assessors to be the total taxable value of land and additions on the property. | Land | Improvement |
|---|---|---|---|---|
| 2024 | $10,506 | $39,000 | $10,500 | $28,500 |
| 2023 | $5,884 | $39,000 | $10,500 | $28,500 |
| 2022 | $7,920 | $39,000 | $10,500 | $28,500 |
| 2021 | $1,251 | $33,700 | $7,780 | $25,920 |
| 2020 | $1,252 | $33,700 | $7,780 | $25,920 |
| 2019 | $1,761 | $33,700 | $7,780 | $25,920 |
| 2018 | $1,674 | $30,740 | $9,900 | $20,840 |
| 2017 | $1,441 | $29,541 | $9,902 | $19,639 |
| 2016 | $1,431 | $29,541 | $9,902 | $19,639 |
| 2015 | $1,393 | $29,159 | $9,520 | $19,639 |
| 2014 | $1,393 | $29,159 | $9,520 | $19,639 |
| 2013 | $681 | $29,159 | $9,520 | $19,639 |
Source: Public Records
Map
Nearby Homes
- 4712 Cullen Ave
- 880 Brendle Trace Unit 28
- 916 Sawmill Ct
- 4622 W Ridgewood Rd
- 970 Forest Edge Ave
- 4514 Dowden St
- 794 Donnelly Ave
- 5127 Stoneridge Dr
- 5249 Taywell Dr
- 593 Hiser Ave
- 5220 Ridgewood Rd E
- 1709 Thomas Dr
- 4740 Merrimont Ave
- 4512 Ridgewood Rd E
- 1461 Student Ave
- 4446 Ridgewood Rd E Unit 3
- 4438 Tacoma St
- 4109 Derr Rd
- 4923 Westmont Dr
- 4913 Westmont Dr
- 4907 Westmont Dr
- 4933 Westmont Dr
- 1009 Moorefield Rd
- 4918 Westmont Dr
- 4901 Westmont Dr
- 4910 Westmont Dr
- 4849 Westmont Dr
- 4902 Westmont Dr
- 1041 Stanway Ave
- 983 Moorefield Rd
- 4848 Westmont Dr
- 4843 Westmont Dr
- 1045 Ferndale Ln
- 1046 Ferndale Ln
- 1049 Stanway Ave
- 4842 Westmont Dr
- 4837 Westmont Dr
- 4944 Stanway Ave