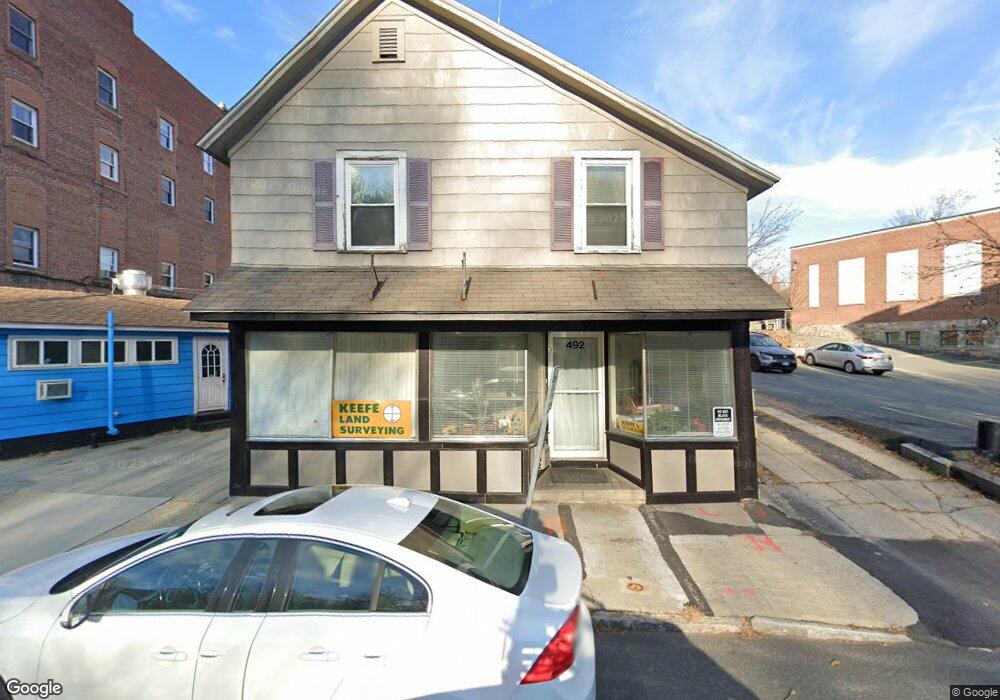
492 Main St Winsted, CT 06098
Estimated Value: $209,155
--
Bed
--
Bath
2,697
Sq Ft
$78/Sq Ft
Est. Value
About This Home
This home is located at 492 Main St, Winsted, CT 06098 and is currently estimated at $209,155, approximately $77 per square foot. 492 Main St is a home located in Litchfield County with nearby schools including Explorations Charter School, St Anthony School, and The Gilbert School.
Ownership History
Date
Name
Owned For
Owner Type
Purchase Details
Closed on
Jun 9, 2022
Sold by
Hefferglynn Llc
Bought by
Impetus Properties Llc
Current Estimated Value
Home Financials for this Owner
Home Financials are based on the most recent Mortgage that was taken out on this home.
Original Mortgage
$123,750
Outstanding Balance
$117,573
Interest Rate
5.1%
Mortgage Type
Commercial
Estimated Equity
$91,582
Purchase Details
Closed on
Jan 15, 2019
Sold by
Smigel Stephen A
Bought by
Hefferglynn Llc
Home Financials for this Owner
Home Financials are based on the most recent Mortgage that was taken out on this home.
Original Mortgage
$73,050
Interest Rate
4.8%
Mortgage Type
New Conventional
Purchase Details
Closed on
May 6, 2003
Sold by
Bentley William C
Bought by
Smigel Stephen A
Purchase Details
Closed on
Jan 4, 1993
Sold by
Pb Real Estate Inc
Bought by
Bentley William C
Home Financials for this Owner
Home Financials are based on the most recent Mortgage that was taken out on this home.
Original Mortgage
$55,000
Interest Rate
8.32%
Mortgage Type
Commercial
Create a Home Valuation Report for This Property
The Home Valuation Report is an in-depth analysis detailing your home's value as well as a comparison with similar homes in the area
Home Values in the Area
Average Home Value in this Area
Purchase History
| Date | Buyer | Sale Price | Title Company |
|---|---|---|---|
| Impetus Properties Llc | $165,000 | None Available | |
| Impetus Properties Llc | $165,000 | None Available | |
| Hefferglynn Llc | $122,500 | -- | |
| Hefferglynn Llc | $122,500 | -- | |
| Smigel Stephen A | $130,500 | -- | |
| Smigel Stephen A | $130,500 | -- | |
| Bentley William C | $95,000 | -- |
Source: Public Records
Mortgage History
| Date | Status | Borrower | Loan Amount |
|---|---|---|---|
| Open | Impetus Properties Llc | $123,750 | |
| Closed | Impetus Properties Llc | $123,750 | |
| Previous Owner | Hefferglynn Llc | $73,050 | |
| Previous Owner | Bentley William C | $55,000 |
Source: Public Records
Tax History Compared to Growth
Tax History
| Year | Tax Paid | Tax Assessment Tax Assessment Total Assessment is a certain percentage of the fair market value that is determined by local assessors to be the total taxable value of land and additions on the property. | Land | Improvement |
|---|---|---|---|---|
| 2025 | $3,406 | $116,760 | $29,120 | $87,640 |
| 2024 | $3,181 | $116,760 | $29,120 | $87,640 |
| 2023 | $3,081 | $116,760 | $29,120 | $87,640 |
| 2022 | $2,287 | $68,180 | $25,970 | $42,210 |
| 2021 | $2,287 | $68,180 | $25,970 | $42,210 |
| 2020 | $2,287 | $68,180 | $25,970 | $42,210 |
| 2019 | $2,287 | $68,180 | $25,970 | $42,210 |
| 2018 | $2,287 | $68,180 | $25,970 | $42,210 |
| 2017 | $2,416 | $72,030 | $37,100 | $34,930 |
| 2016 | $2,416 | $72,030 | $37,100 | $34,930 |
| 2015 | $2,355 | $72,030 | $37,100 | $34,930 |
| 2014 | $2,298 | $72,030 | $37,100 | $34,930 |
Source: Public Records
Map
Nearby Homes