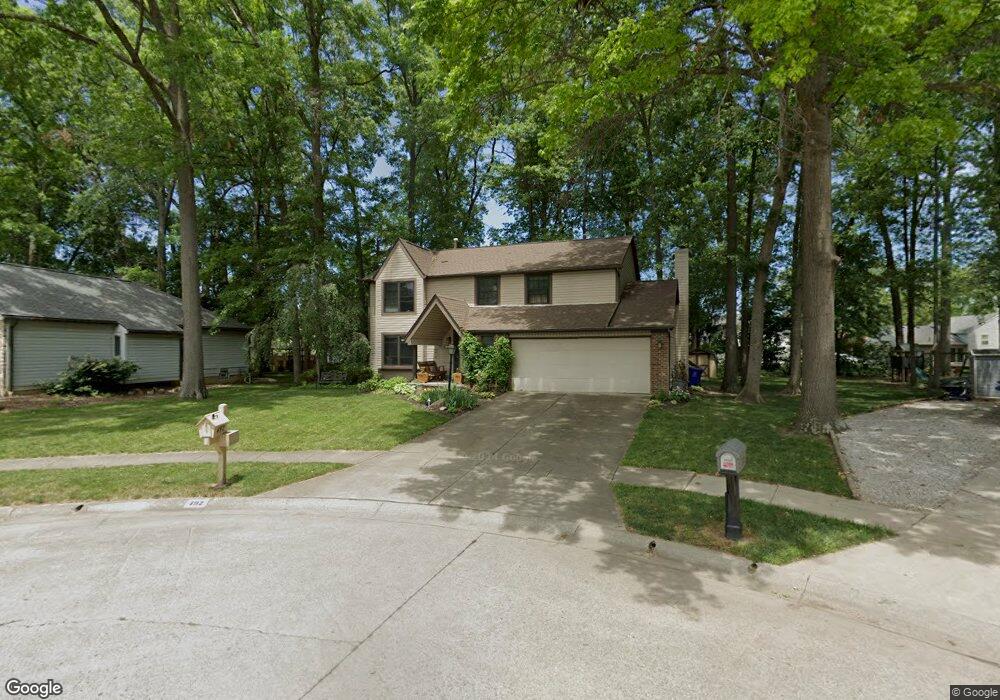
492 Waring Way Columbus, OH 43213
Olde Orchard NeighborhoodEstimated Value: $342,746 - $381,000
4
Beds
3
Baths
1,826
Sq Ft
$196/Sq Ft
Est. Value
About This Home
This home is located at 492 Waring Way, Columbus, OH 43213 and is currently estimated at $357,437, approximately $195 per square foot. 492 Waring Way is a home located in Franklin County with nearby schools including Olde Orchard Elementary School, Sherwood Middle School, and Walnut Ridge High School.
Ownership History
Date
Name
Owned For
Owner Type
Purchase Details
Closed on
Apr 30, 2002
Sold by
Hale Kathleen M
Bought by
Cafmeyer Jeffrey
Current Estimated Value
Home Financials for this Owner
Home Financials are based on the most recent Mortgage that was taken out on this home.
Original Mortgage
$170,900
Outstanding Balance
$72,714
Interest Rate
7.18%
Estimated Equity
$284,723
Purchase Details
Closed on
Feb 15, 1989
Bought by
Hale Kathleen M
Purchase Details
Closed on
Oct 18, 1988
Purchase Details
Closed on
May 11, 1988
Create a Home Valuation Report for This Property
The Home Valuation Report is an in-depth analysis detailing your home's value as well as a comparison with similar homes in the area
Home Values in the Area
Average Home Value in this Area
Purchase History
| Date | Buyer | Sale Price | Title Company |
|---|---|---|---|
| Cafmeyer Jeffrey | $170,900 | Lll Title | |
| Hale Kathleen M | -- | -- | |
| -- | $112,000 | -- | |
| -- | $25,000 | -- |
Source: Public Records
Mortgage History
| Date | Status | Borrower | Loan Amount |
|---|---|---|---|
| Open | Cafmeyer Jeffrey | $170,900 |
Source: Public Records
Tax History Compared to Growth
Tax History
| Year | Tax Paid | Tax Assessment Tax Assessment Total Assessment is a certain percentage of the fair market value that is determined by local assessors to be the total taxable value of land and additions on the property. | Land | Improvement |
|---|---|---|---|---|
| 2024 | $4,670 | $104,060 | $31,500 | $72,560 |
| 2023 | $4,610 | $104,055 | $31,500 | $72,555 |
| 2022 | $2,527 | $48,720 | $16,100 | $32,620 |
| 2021 | $2,531 | $48,720 | $16,100 | $32,620 |
| 2020 | $2,535 | $48,720 | $16,100 | $32,620 |
| 2019 | $2,573 | $42,420 | $14,000 | $28,420 |
| 2018 | $2,892 | $42,420 | $14,000 | $28,420 |
| 2017 | $3,041 | $41,860 | $14,000 | $27,860 |
| 2016 | $3,543 | $53,490 | $12,430 | $41,060 |
| 2015 | $3,217 | $53,490 | $12,430 | $41,060 |
| 2014 | $3,224 | $53,490 | $12,430 | $41,060 |
| 2013 | $1,674 | $56,315 | $13,090 | $43,225 |
Source: Public Records
Map
Nearby Homes
- 6560 Schenk Ave
- 6279 Braiden Ct Unit 10B
- 541 Woodingham Place Unit 2-C
- 557 Woodingham Place Unit 1A
- 6610 Olivetree Ct
- 6231 Peach Tree Rd
- 651 Cranfield Place
- 6056 Naughten Pond Dr
- 6052 Naughten Pond Dr
- 147 Shadymere Ln Unit 5
- 6626 Red Fox Rd
- 117 Stornoway Dr E
- 142 Villamere Dr Unit 6
- 6040 Naughten Pond Dr
- 6198 Stornoway Dr S Unit 6198
- 6737 Rocky Den Rd
- 6483 Borr Ave
- 85 Stornoway Dr W Unit 85
- 6810 Prior Place
- 6495 Balsam Dr
- 500 Waring Way
- 6424 Plankton Dr
- 6459 Hilltop Ave
- 6469 Hilltop Ave
- 6449 Hilltop Ave
- 508 Waring Way
- 6416 Plankton Dr
- 6481 Hilltop Ave
- 6439 Hilltop Ave
- 523 Brice Rd
- 533 Brice Rd
- 6423 Plankton Dr
- 516 Waring Way
- 6427 Hilltop Ave
- 507 Brice Rd
- 545 Brice Rd
- 6415 Plankton Dr
- 6408 Plankton Dr
- 513 Waring Way
- 6454 Hilltop Ave