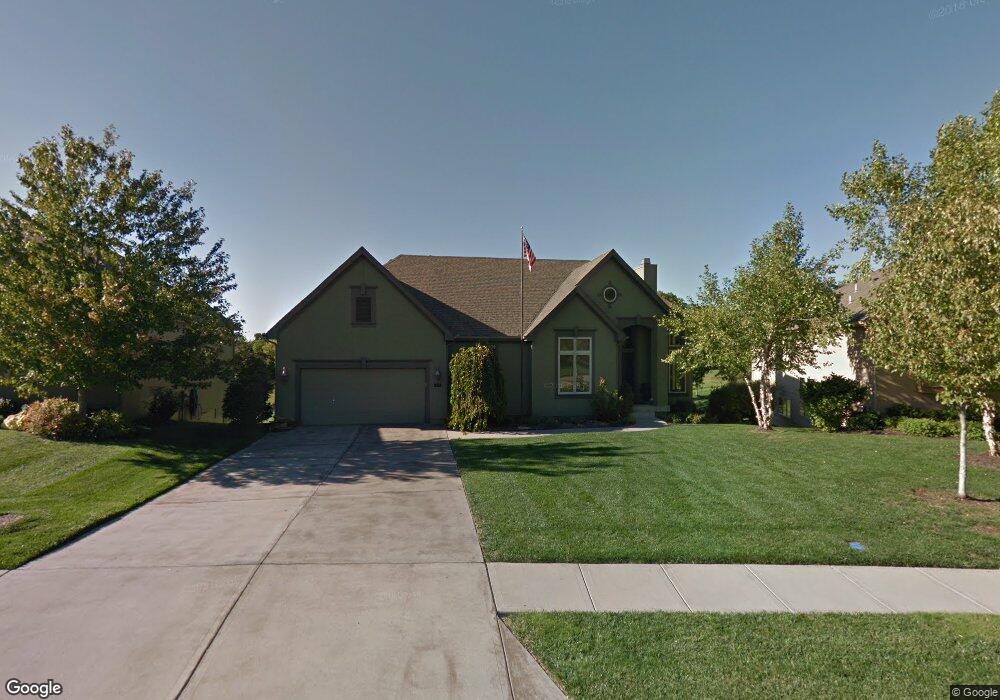
4920 Bradshaw St Shawnee, KS 66216
Estimated Value: $508,422 - $595,000
3
Beds
3
Baths
1,794
Sq Ft
$309/Sq Ft
Est. Value
About This Home
This home is located at 4920 Bradshaw St, Shawnee, KS 66216 and is currently estimated at $553,606, approximately $308 per square foot. 4920 Bradshaw St is a home located in Johnson County with nearby schools including Ray Marsh Elementary School, Trailridge Middle School, and Shawnee Mission Northwest High School.
Ownership History
Date
Name
Owned For
Owner Type
Purchase Details
Closed on
Feb 10, 2014
Sold by
Taylor Karla K and Firehammer Karla K
Bought by
Nelson Teresa J and Teresa J Nelson Living Trust
Current Estimated Value
Purchase Details
Closed on
Dec 14, 2005
Sold by
J F Pashman L L C
Bought by
Gordon Steve A and Steve A Gordon Revocable Trust
Home Financials for this Owner
Home Financials are based on the most recent Mortgage that was taken out on this home.
Original Mortgage
$375,463
Interest Rate
6.22%
Mortgage Type
Future Advance Clause Open End Mortgage
Purchase Details
Closed on
Apr 25, 2005
Sold by
Pflumm 51 Investors Llc
Bought by
Jf Pasham Llc
Home Financials for this Owner
Home Financials are based on the most recent Mortgage that was taken out on this home.
Original Mortgage
$316,253
Interest Rate
5.93%
Mortgage Type
Construction
Create a Home Valuation Report for This Property
The Home Valuation Report is an in-depth analysis detailing your home's value as well as a comparison with similar homes in the area
Home Values in the Area
Average Home Value in this Area
Purchase History
| Date | Buyer | Sale Price | Title Company |
|---|---|---|---|
| Nelson Teresa J | -- | Stweart Title Co | |
| Gordon Steve A | -- | First American Title Ins Co | |
| Jf Pasham Llc | -- | First American Title |
Source: Public Records
Mortgage History
| Date | Status | Borrower | Loan Amount |
|---|---|---|---|
| Previous Owner | Gordon Steve A | $375,463 | |
| Previous Owner | Jf Pasham Llc | $316,253 |
Source: Public Records
Tax History Compared to Growth
Tax History
| Year | Tax Paid | Tax Assessment Tax Assessment Total Assessment is a certain percentage of the fair market value that is determined by local assessors to be the total taxable value of land and additions on the property. | Land | Improvement |
|---|---|---|---|---|
| 2024 | $6,119 | $57,408 | $11,809 | $45,599 |
| 2023 | $6,017 | $56,017 | $11,245 | $44,772 |
| 2022 | $6,703 | $62,158 | $11,245 | $50,913 |
| 2021 | $6,399 | $55,982 | $10,215 | $45,767 |
| 2020 | $6,474 | $55,901 | $10,215 | $45,686 |
| 2019 | $6,243 | $53,878 | $9,284 | $44,594 |
| 2018 | $6,162 | $52,981 | $9,284 | $43,697 |
| 2017 | $5,812 | $49,186 | $8,471 | $40,715 |
| 2016 | $5,586 | $46,667 | $8,471 | $38,196 |
| 2015 | $5,411 | $46,667 | $8,471 | $38,196 |
| 2013 | -- | $43,792 | $7,700 | $36,092 |
Source: Public Records
Map
Nearby Homes
- 5013 Bradshaw St
- 5021 Bradshaw St
- 13305 W 51st St
- 12023 W 48th St
- 13130 W 52nd Terrace
- 13126 W 52nd Terrace
- 13134 W 52nd Terrace
- 11907 W 49th Place
- 14105 W 48th Terrace
- W 48th St
- 13810 W 53rd St
- 14210 W 50th St
- 5507 Noland Rd
- 6804 Woodend Ave
- 5407 Halsey St
- 5504 Monrovia St
- 11815 W 53rd St
- 12508 W 56th St
- 13804 W 55th Terrace
- 5530 Rene St
- 4924 Bradshaw St
- 4916 Bradshaw St
- 4928 Bradshaw St
- 4912 Bradshaw St
- 4921 Bradshaw St
- 4911 Bradshaw St
- 4932 Bradshaw St
- 4908 Bradshaw St
- 12826 W 49th Terrace
- 4860 Black Swan Dr
- 4905 Bradshaw St
- 4904 Bradshaw St
- 4936 Bradshaw St
- 12822 W 49th Terrace
- 4856 Black Swan Dr
- 12732 W 49th St
- 4908 Parkhill St
- 12823 W 49th Terrace
- 12818 W 49th Terrace
- 4940 Bradshaw St