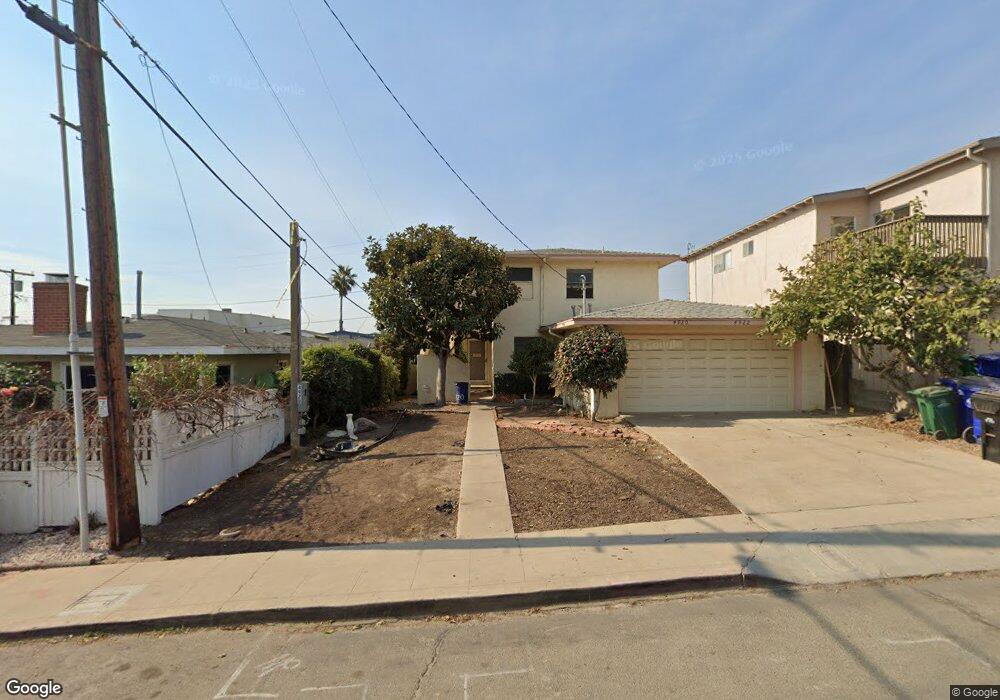
4920 Dixie Dr San Diego, CA 92109
Pacific Beach NeighborhoodEstimated Value: $2,384,000 - $2,894,000
4
Beds
2
Baths
1,436
Sq Ft
$1,884/Sq Ft
Est. Value
About This Home
This home is located at 4920 Dixie Dr, San Diego, CA 92109 and is currently estimated at $2,705,055, approximately $1,883 per square foot. 4920 Dixie Dr is a home located in San Diego County with nearby schools including Bird Rock Elementary School, Muirlands Middle School, and La Jolla High School.
Ownership History
Date
Name
Owned For
Owner Type
Purchase Details
Closed on
Aug 12, 2021
Sold by
Andrew Taylor Marvin
Bought by
Catherine B Thompson Living Trust
Current Estimated Value
Purchase Details
Closed on
Jul 27, 2021
Sold by
Taylor Scott Allen and Campbel Connie Denise
Bought by
Minhas Sandip S and Minhas Jennifer A
Purchase Details
Closed on
Feb 22, 2000
Sold by
Thompson Catherine B Living Trust and Edward Gail Edward
Bought by
Taylor Marvin A and Taylor Janet L
Purchase Details
Closed on
Jan 5, 2000
Sold by
Thompson Catherine B Living Trust and Edward Gail Edward
Bought by
Thompson Gail Edward and Taylor Janet Louise
Purchase Details
Closed on
Jul 27, 1999
Sold by
Thompson Catherine B Trust and Edward Gail Edward
Bought by
Taylor Marvin A and Taylor Janet L
Purchase Details
Closed on
Jul 26, 1999
Sold by
Thompson Steven Kent and Harris Theresa May
Bought by
Taylor Marvin A and Taylor Janet L
Create a Home Valuation Report for This Property
The Home Valuation Report is an in-depth analysis detailing your home's value as well as a comparison with similar homes in the area
Home Values in the Area
Average Home Value in this Area
Purchase History
| Date | Buyer | Sale Price | Title Company |
|---|---|---|---|
| Catherine B Thompson Living Trust | -- | -- | |
| Minhas Sandip S | $2,500,000 | Fidelity Natl Ttl San Diego | |
| Catherine B Thompson Living Trust | -- | -- | |
| Taylor Marvin A | -- | -- | |
| Thompson Gail Edward | -- | -- | |
| Thompson Steven Kent | -- | -- | |
| Thompson Gail Edward | -- | -- | |
| Taylor Marvin A | $134,000 | -- | |
| Thompson Gail Edward | -- | Commonwealth Title | |
| Taylor Marvin A | $115,000 | Commonwealth Title | |
| Harris Theresa May | -- | Commonwealth Title |
Source: Public Records
Tax History Compared to Growth
Tax History
| Year | Tax Paid | Tax Assessment Tax Assessment Total Assessment is a certain percentage of the fair market value that is determined by local assessors to be the total taxable value of land and additions on the property. | Land | Improvement |
|---|---|---|---|---|
| 2025 | $32,004 | $2,653,019 | $2,509,756 | $143,263 |
| 2024 | $32,004 | $2,601,000 | $2,460,546 | $140,454 |
| 2023 | $31,298 | $2,550,000 | $2,412,300 | $137,700 |
| 2022 | $30,466 | $2,500,000 | $2,365,000 | $135,000 |
| 2021 | $2,125 | $167,919 | $113,823 | $54,096 |
| 2020 | $2,099 | $166,198 | $112,656 | $53,542 |
| 2019 | $2,062 | $162,941 | $110,448 | $52,493 |
| 2018 | $1,930 | $159,747 | $108,283 | $51,464 |
| 2017 | $1,884 | $156,615 | $106,160 | $50,455 |
| 2016 | $1,853 | $153,545 | $104,079 | $49,466 |
| 2015 | $1,825 | $151,239 | $102,516 | $48,723 |
| 2014 | $1,715 | $148,277 | $100,508 | $47,769 |
Source: Public Records
Map
Nearby Homes
- 4767 Ocean Blvd
- 4767 Ocean Blvd Unit 411
- 5061 Mission Blvd
- 4667 Ocean Blvd Unit 106
- 4944 Cass St Unit 1003
- 4944 Cass St Unit 409
- 4944 Cass St Unit 407
- 911 Missouri St Unit 8
- 727 Sapphire St Unit 301
- 751-63 Turquoise St Unit 27-30
- 4918 Dawes St Unit 3
- 835 Felspar St Week 6
- 4975 Dawes St
- 972 Sapphire St Unit LA1
- 976 Sapphire St Unit LA3
- 4475 Mission Blvd Unit 1
- 4465 Ocean Blvd Unit 4
- 924 Hornblend St Unit 210
- 1235 Wilbur Ave
- 866 Grand Ave
- 4920-22 Dixie Dr
- 4928 Dixie Dr Unit 30
- 4912 Dixie Dr Unit 14
- 4927 Ocean Blvd Unit 29
- 4904 Dixie Dr Unit 6
- 4945 Crystal Dr Unit 47
- 4933 Ocean Blvd Unit 35
- 4919 Ocean Blvd Unit 21
- 4913 Dixie Dr
- 4937 Crystal Dr
- 4911 Ocean Blvd
- 4896 Dixie Dr Unit 98
- 4919 Dixie Dr Unit 21
- 4911-13 Dixie Dr
- 4911 Dixie Dr Unit 13
- 4927 Dixie Dr Unit 29
- 4901-3 Ocean Blvd
- 4901 Ocean Blvd Unit 3
- 702 Beryl St
- 4892 Dixie Dr Unit 94