4920 Hampton Rd La Canada Flintridge, CA 91011
Estimated Value: $2,317,615 - $2,946,000
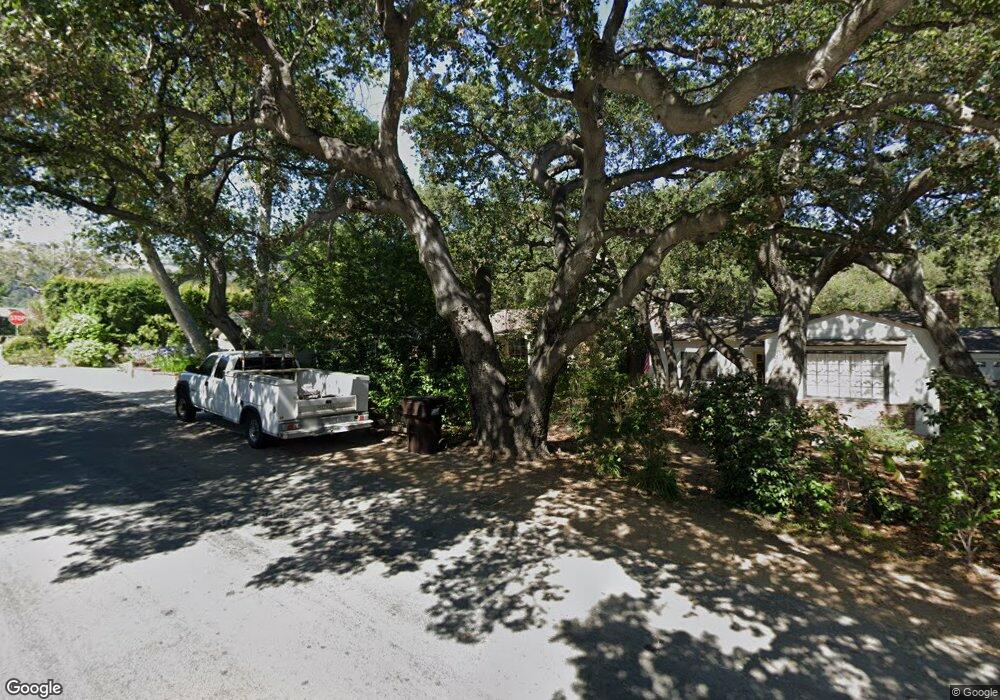
About This Home
This home is located at 4920 Hampton Rd, La Canada Flintridge, CA 91011 and is currently estimated at $2,578,654, approximately $1,121 per square foot. 4920 Hampton Rd is a home located in Los Angeles County with nearby schools including Paradise Canyon Elementary School, La Canada High School, and La Canada Preparatory School.
Ownership History
We collect this data history from publicly available records. To have your information removed, we recommend requesting removal directly through your county’s website.
Purchase Details
Purchase Details
Home Financials for this Owner
Home Financials are based on the most recent Mortgage that was taken out on this home.Purchase Details
Home Financials for this Owner
Home Financials are based on the most recent Mortgage that was taken out on this home.Home Values in the Area
Average Home Value in this Area
Purchase History
We collect this data history from publicly available records. To have your information removed, we recommend requesting removal directly through your county’s website.
| Date | Buyer | Sale Price | Title Company |
|---|---|---|---|
| -- | -- | ||
| $720,000 | Southland Title Corporation | ||
| $645,500 | Old Republic Title |
Mortgage History
We collect this data history from publicly available records. To have your information removed, we recommend requesting removal directly through your county’s website.
| Date | Status | Borrower | Loan Amount |
|---|---|---|---|
| Open | $275,000 | ||
| Previous Owner | $516,400 | ||
| Closed | $50,000 |
Tax History
We collect this data history from publicly available records. To have your information removed, we recommend requesting removal directly through your county’s website.
| Year | Tax Paid | Tax Assessment Tax Assessment Total Assessment is a certain percentage of the fair market value that is determined by local assessors to be the total taxable value of land and additions on the property. | Land | Improvement |
|---|---|---|---|---|
| 2025 | $12,820 | $1,081,228 | $689,596 | $391,632 |
| 2024 | $12,448 | $1,060,028 | $676,075 | $383,953 |
| 2023 | $12,091 | $1,039,244 | $662,819 | $376,425 |
| 2022 | $11,651 | $1,018,868 | $649,823 | $369,045 |
| 2021 | $11,567 | $998,891 | $637,082 | $361,809 |
| 2019 | $11,216 | $969,266 | $618,187 | $351,079 |
| 2018 | $11,046 | $950,262 | $606,066 | $344,196 |
| 2016 | $11,217 | $913,365 | $582,533 | $330,832 |
| 2015 | $11,072 | $899,646 | $573,783 | $325,863 |
| 2014 | $10,927 | $882,024 | $562,544 | $319,480 |
Map
- 369 San Juan Way
- 4909 Indianola Way
- 602 Durwood Dr
- 481 Paulette Place
- 4923 Burgoyne Ln
- 4820 Burgoyne Ln
- 4618 Crown Ave
- 5065 Indianola Way
- 322 Starlight Crest Dr
- 500 Georgian Rd
- 770 Galaxy Heights Dr
- 745 Galaxy Heights Dr
- 720 Starlight Heights Dr
- 904 Wiladonda Dr
- 168 Lamour Dr
- 5029 Princess Anne Rd
- 951 Descanso Dr
- 519 Meadow Grove St
- 555 Meadow Grove St
- 0 Hilldale
- 4926 Hampton Rd
- 4916 Hampton Rd
- 4953 Del Monte Rd
- 4947 Del Monte Rd
- 4910 Hampton Rd
- 4943 Del Monte Rd
- 4923 Hampton Rd
- 4917 Hampton Rd
- 4927 Hampton Rd
- 4904 Hampton Rd
- 375 Santa Inez Way
- 4911 Hampton Rd
- 4935 Del Monte Rd
- 4935 Hampton Rd
- 369 Santa Inez Way
- 369 Santa Inez Way
- 379 Santa Inez Way
- 385 Santa Inez Way
- 4905 Hampton Rd
- 4931 Del Monte Rd
Ask me questions while you tour the home.