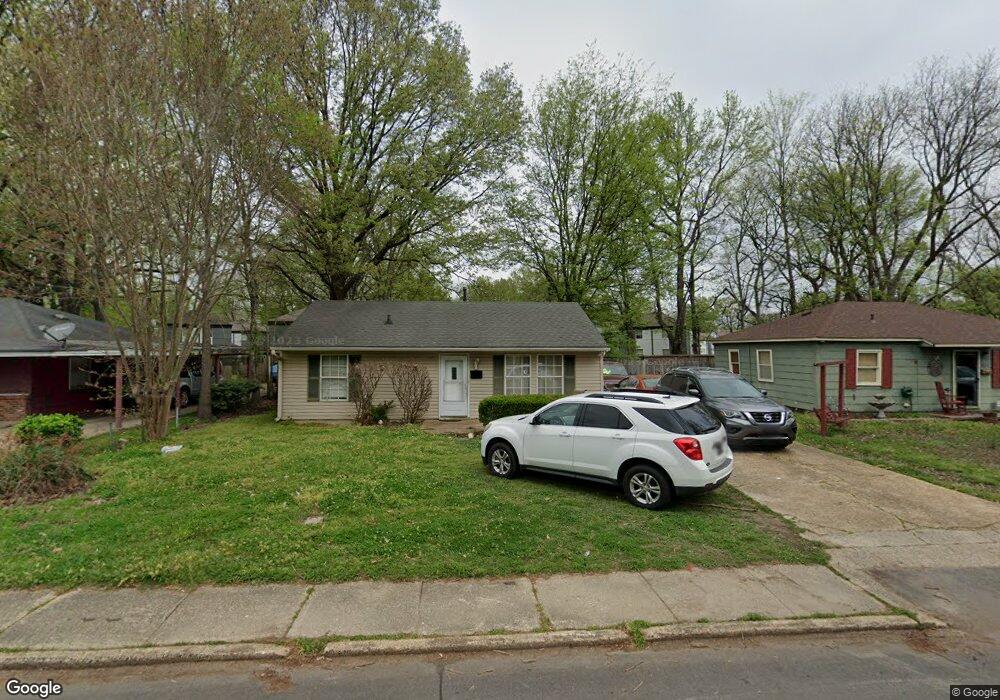
4920 Montgomery Rd Millington, TN 38053
Estimated Value: $110,000 - $136,000
3
Beds
1
Bath
875
Sq Ft
$141/Sq Ft
Est. Value
About This Home
This home is located at 4920 Montgomery Rd, Millington, TN 38053 and is currently estimated at $123,000, approximately $140 per square foot. 4920 Montgomery Rd is a home located in Shelby County with nearby schools including Millington Elementary School, Millington High School, and Lighthouse Christian Academy.
Ownership History
Date
Name
Owned For
Owner Type
Purchase Details
Closed on
Jan 11, 2012
Sold by
Two Brothers Llc
Bought by
Hodges Daniel and Hodges Angela
Current Estimated Value
Home Financials for this Owner
Home Financials are based on the most recent Mortgage that was taken out on this home.
Original Mortgage
$197,600
Outstanding Balance
$136,115
Interest Rate
4.08%
Mortgage Type
Purchase Money Mortgage
Estimated Equity
-$13,115
Purchase Details
Closed on
Mar 19, 2004
Sold by
Hodges Richard
Bought by
Two Brothers Llc
Home Financials for this Owner
Home Financials are based on the most recent Mortgage that was taken out on this home.
Original Mortgage
$44,000
Interest Rate
5.54%
Mortgage Type
Purchase Money Mortgage
Purchase Details
Closed on
Sep 30, 2003
Sold by
Collier Roddrick C
Bought by
Hodges Richard
Purchase Details
Closed on
Sep 1, 2003
Sold by
Lindsey Paul F
Bought by
Collier Roddrick D
Create a Home Valuation Report for This Property
The Home Valuation Report is an in-depth analysis detailing your home's value as well as a comparison with similar homes in the area
Home Values in the Area
Average Home Value in this Area
Purchase History
| Date | Buyer | Sale Price | Title Company |
|---|---|---|---|
| Hodges Daniel | $232,000 | None Available | |
| Two Brothers Llc | -- | -- | |
| Hodges Richard | $11,500 | Tri State Title & Escrow | |
| Collier Roddrick D | $40,000 | -- |
Source: Public Records
Mortgage History
| Date | Status | Borrower | Loan Amount |
|---|---|---|---|
| Open | Hodges Daniel | $197,600 | |
| Previous Owner | Two Brothers Llc | $44,000 |
Source: Public Records
Tax History Compared to Growth
Tax History
| Year | Tax Paid | Tax Assessment Tax Assessment Total Assessment is a certain percentage of the fair market value that is determined by local assessors to be the total taxable value of land and additions on the property. | Land | Improvement |
|---|---|---|---|---|
| 2025 | $491 | $24,275 | $4,975 | $19,300 |
| 2024 | -- | $17,550 | $3,625 | $13,925 |
| 2023 | $841 | $17,550 | $3,625 | $13,925 |
| 2022 | $841 | $17,550 | $3,625 | $13,925 |
| 2021 | $851 | $17,550 | $3,625 | $13,925 |
| 2020 | $770 | $13,800 | $3,625 | $10,175 |
| 2019 | $559 | $13,800 | $3,625 | $10,175 |
| 2018 | $770 | $13,800 | $3,625 | $10,175 |
| 2017 | $778 | $13,800 | $3,625 | $10,175 |
| 2016 | $869 | $14,725 | $0 | $0 |
| 2014 | $643 | $14,725 | $0 | $0 |
Source: Public Records
Map
Nearby Homes
- 4812 Janie Ave
- 4880 Easley Ave
- 4741 Janie Ave
- 4721 Janie Ave
- 4752 Janie Cove
- 4853 2nd Ave
- 4655 Doris Cir S
- 5852 U S Highway 51
- 4915 1st Ave
- 7727 Tecumseh St
- 8852 U S 51
- 7988 Royster Creek Dr E
- 5037 Shellback Dr
- 5051 Shellback Dr
- 5119 Shellback Dr
- 7288 U S Highway 51
- 0000 U S Highway 51
- 7963 Royster Creek Dr
- 7955 Royster Creek Dr
- 7943 Royster Creek Dr
- 4924 Montgomery Rd
- 4914 Montgomery Rd
- 4908 Montgomery Rd
- 4930 Montgomery Rd
- 4902 Montgomery Rd
- 4934 Montgomery Rd
- 4931 Montgomery Rd
- 4919 Montgomery Rd
- 4913 Montgomery Rd
- 4907 Montgomery Rd
- 4896 Montgomery Rd
- 4949 Montgomery Rd
- 4901 Montgomery Rd
- 4940 Montgomery Rd
- 7834 Harrold Cove
- 4890 Montgomery Rd
- 4895 Montgomery Rd
- 4944 Saratoga Rd
- 4950 Montgomery Rd
- 7842 Harrold Cove