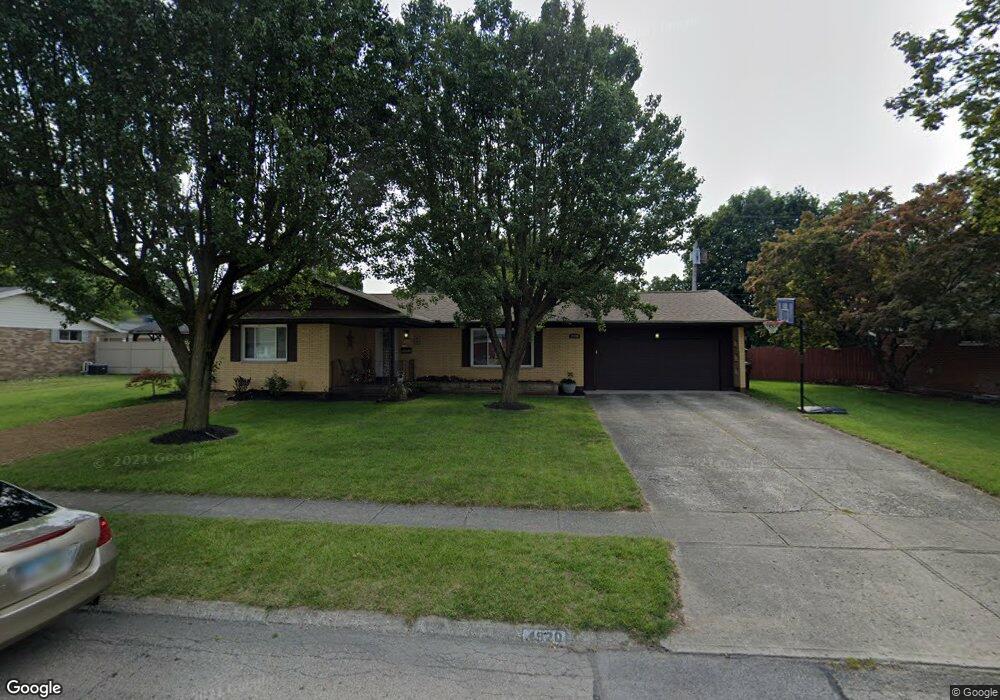
4920 Ridgewood Rd W Springfield, OH 45503
Estimated Value: $223,000 - $271,000
3
Beds
2
Baths
1,324
Sq Ft
$181/Sq Ft
Est. Value
About This Home
This home is located at 4920 Ridgewood Rd W, Springfield, OH 45503 and is currently estimated at $240,197, approximately $181 per square foot. 4920 Ridgewood Rd W is a home located in Clark County with nearby schools including Rolling Hills Elementary School, Northridge Elementary School, and Northridge Middle School.
Ownership History
Date
Name
Owned For
Owner Type
Purchase Details
Closed on
Oct 12, 2022
Sold by
Conley Renee B
Bought by
Conley Renee B and Conley Steven W
Current Estimated Value
Purchase Details
Closed on
Mar 29, 2013
Sold by
Niclin Group Llc
Bought by
Eaton Renee B
Home Financials for this Owner
Home Financials are based on the most recent Mortgage that was taken out on this home.
Original Mortgage
$118,265
Interest Rate
3.52%
Mortgage Type
New Conventional
Purchase Details
Closed on
Sep 13, 2012
Sold by
Bank Of America N A
Bought by
Niclin Group Llc
Purchase Details
Closed on
Apr 23, 2012
Sold by
Blair Jeffery and Blair Jeffrey A
Bought by
Bank Of America Na
Purchase Details
Closed on
Jun 29, 1999
Sold by
Blanken Albert A
Bought by
Blair Jeffrey A
Home Financials for this Owner
Home Financials are based on the most recent Mortgage that was taken out on this home.
Original Mortgage
$94,900
Interest Rate
7.29%
Mortgage Type
Purchase Money Mortgage
Create a Home Valuation Report for This Property
The Home Valuation Report is an in-depth analysis detailing your home's value as well as a comparison with similar homes in the area
Home Values in the Area
Average Home Value in this Area
Purchase History
| Date | Buyer | Sale Price | Title Company |
|---|---|---|---|
| Conley Renee B | -- | -- | |
| Conley Renee B | -- | None Listed On Document | |
| Eaton Renee B | $115,900 | None Available | |
| Niclin Group Llc | $59,500 | None Available | |
| Bank Of America Na | $73,400 | None Available | |
| Blair Jeffrey A | $99,900 | -- |
Source: Public Records
Mortgage History
| Date | Status | Borrower | Loan Amount |
|---|---|---|---|
| Previous Owner | Eaton Renee B | $118,265 | |
| Previous Owner | Blair Jeffrey A | $94,900 |
Source: Public Records
Tax History Compared to Growth
Tax History
| Year | Tax Paid | Tax Assessment Tax Assessment Total Assessment is a certain percentage of the fair market value that is determined by local assessors to be the total taxable value of land and additions on the property. | Land | Improvement |
|---|---|---|---|---|
| 2024 | $2,421 | $55,990 | $11,000 | $44,990 |
| 2023 | $2,421 | $55,990 | $11,000 | $44,990 |
| 2022 | $2,430 | $55,990 | $11,000 | $44,990 |
| 2021 | $2,132 | $41,620 | $8,150 | $33,470 |
| 2020 | $2,134 | $41,620 | $8,150 | $33,470 |
| 2019 | $2,174 | $41,620 | $8,150 | $33,470 |
| 2018 | $2,114 | $38,820 | $10,430 | $28,390 |
| 2017 | $1,820 | $36,275 | $10,427 | $25,848 |
| 2016 | $1,807 | $36,275 | $10,427 | $25,848 |
| 2015 | $1,847 | $35,872 | $10,024 | $25,848 |
| 2014 | $1,847 | $35,872 | $10,024 | $25,848 |
| 2013 | $1,805 | $35,872 | $10,024 | $25,848 |
Source: Public Records
Map
Nearby Homes
- 4712 Cullen Ave
- 5127 Stoneridge Dr
- 4622 W Ridgewood Rd
- 5249 Taywell Dr
- 5220 Ridgewood Rd E
- 1709 Thomas Dr
- 4740 Merrimont Ave
- 880 Brendle Trace Unit 28
- 4512 Ridgewood Rd E
- 916 Sawmill Ct
- 970 Forest Edge Ave
- 4446 Ridgewood Rd E Unit 3
- 1461 Student Ave
- 4514 Dowden St
- 4849 Ashley Dr
- 4620 Eldora St
- 4620 Eldora Dr
- 4438 Tacoma St
- 794 Donnelly Ave
- 4932 Ridgewood Rd W
- 4910 Ridgewood Rd W
- 4925 W Ridgewood Rd
- 4925 Ridgewood Rd W
- 4935 W Ridgewood Rd
- 4900 Ridgewood Rd W
- 4935 Ridgewood Rd W
- 4944 Ridgewood Rd W
- 4900 W Ridgewood Rd
- 4909 Ridgewood Rd W
- 4945 W Ridgewood Rd
- 4945 Ridgewood Rd W
- 1220 Stanway Ave
- 4848 Ridgewood Rd W
- 1210 Ferndale Ln
- 1223 Stanway Ave
- 1219 Moorefield Rd
- 1214 Ferndale Ln
- 4842 Ridgewood Rd W
- 1206 Ferndale Ln