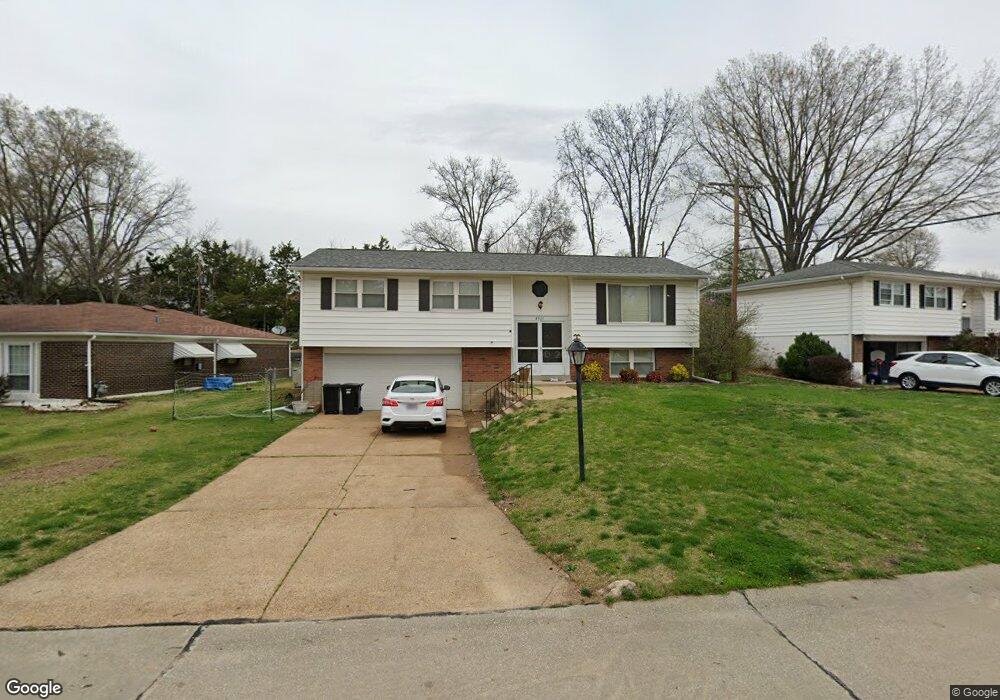
4921 Brockwood Dr Saint Louis, MO 63128
Estimated Value: $287,000 - $358,000
3
Beds
2
Baths
1,527
Sq Ft
$208/Sq Ft
Est. Value
About This Home
This home is located at 4921 Brockwood Dr, Saint Louis, MO 63128 and is currently estimated at $316,938, approximately $207 per square foot. 4921 Brockwood Dr is a home located in St. Louis County with nearby schools including Kennerly Elementary School, Sperreng Middle School, and Lindbergh High School.
Ownership History
Date
Name
Owned For
Owner Type
Purchase Details
Closed on
Sep 14, 2018
Sold by
Busevac Nermin and Busevac Leila
Bought by
Busevac Nermin
Current Estimated Value
Home Financials for this Owner
Home Financials are based on the most recent Mortgage that was taken out on this home.
Original Mortgage
$127,500
Outstanding Balance
$110,959
Interest Rate
4.5%
Mortgage Type
New Conventional
Estimated Equity
$205,979
Purchase Details
Closed on
Aug 25, 2011
Sold by
Busevac Nermin and Busevac Leila
Bought by
Busevac Nermin and Busevac Leila
Home Financials for this Owner
Home Financials are based on the most recent Mortgage that was taken out on this home.
Original Mortgage
$144,329
Interest Rate
3.75%
Mortgage Type
FHA
Purchase Details
Closed on
Jan 25, 2010
Sold by
Heuer Craig and Heuer Julie A
Bought by
Busevac Nermin and Delic Leila
Home Financials for this Owner
Home Financials are based on the most recent Mortgage that was taken out on this home.
Original Mortgage
$146,301
Interest Rate
5.5%
Mortgage Type
FHA
Create a Home Valuation Report for This Property
The Home Valuation Report is an in-depth analysis detailing your home's value as well as a comparison with similar homes in the area
Home Values in the Area
Average Home Value in this Area
Purchase History
| Date | Buyer | Sale Price | Title Company |
|---|---|---|---|
| Busevac Nermin | -- | Investors Title Company Clay | |
| Busevac Nermin | -- | Assured Title Company West | |
| Busevac Nermin | $149,000 | None Available |
Source: Public Records
Mortgage History
| Date | Status | Borrower | Loan Amount |
|---|---|---|---|
| Open | Busevac Nermin | $127,500 | |
| Closed | Busevac Nermin | $144,329 | |
| Closed | Busevac Nermin | $146,301 |
Source: Public Records
Tax History Compared to Growth
Tax History
| Year | Tax Paid | Tax Assessment Tax Assessment Total Assessment is a certain percentage of the fair market value that is determined by local assessors to be the total taxable value of land and additions on the property. | Land | Improvement |
|---|---|---|---|---|
| 2025 | $3,057 | $50,490 | $15,680 | $34,810 |
| 2024 | $3,057 | $46,900 | $15,680 | $31,220 |
| 2023 | $3,057 | $46,900 | $15,680 | $31,220 |
| 2022 | $2,489 | $36,660 | $15,680 | $20,980 |
| 2021 | $2,401 | $36,660 | $15,680 | $20,980 |
| 2020 | $2,340 | $34,470 | $15,680 | $18,790 |
| 2019 | $2,335 | $34,470 | $15,680 | $18,790 |
| 2018 | $2,185 | $29,320 | $9,580 | $19,740 |
| 2017 | $2,161 | $29,320 | $9,580 | $19,740 |
| 2016 | $2,276 | $29,340 | $8,720 | $20,620 |
| 2015 | $2,241 | $29,340 | $8,720 | $20,620 |
| 2014 | $2,281 | $29,580 | $7,790 | $21,790 |
Source: Public Records
Map
Nearby Homes
- 4839 Hursley Dr
- 4833 Hursley Dr
- 4942 Caribee Dr
- 5135 Towne Centre Dr
- 4801 Langtree Dr
- 5057 Peyton Place Ct
- 5100 Melitta Dr
- 5102 Peyton Place Ct
- 4645 Tauneybrook Dr
- 4643 Littlebury Dr
- 4818 Chapel Hill Dr
- 4915 Butler Hill Rd
- 4947 Butler Hill Rd
- 5161 Butler Bend Dr
- 5263 Faro Dr
- 5317 Hamlin Ct
- 10016 Schuessler Rd
- 4449 Pinyon Jay Ct
- 4829 Vermilion Dr
- 4921 Kerth Rd
- 4927 Brockwood Dr
- 4915 Brockwood Dr
- 4933 Brockwood Dr
- 4909 Brockwood Dr
- 4840 Morestead Dr
- 4834 Morestead Dr
- 4924 Brockwood Dr
- 4835 Towne South Rd
- 4920 Brockwood Dr
- 4939 Brockwood Dr
- 4930 Brockwood Dr
- 4847 Towne South Rd
- 4916 Brockwood Dr
- 4829 Towne South Rd
- 4833 Morestead Dr
- 4936 Brockwood Dr
- 4828 Morestead Dr
- 4900 Brockwood Dr
- 4945 Brockwood Dr
- 4942 Brockwood Dr