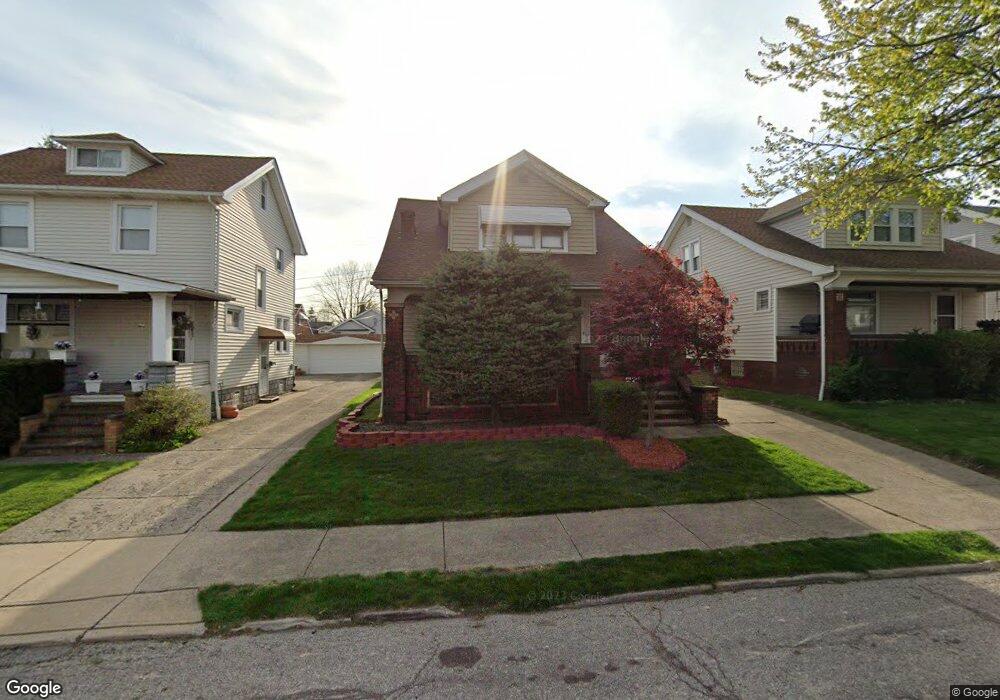
4921 E 106th St Cleveland, OH 44125
Estimated Value: $121,759 - $206,000
4
Beds
2
Baths
1,425
Sq Ft
$113/Sq Ft
Est. Value
About This Home
This home is located at 4921 E 106th St, Cleveland, OH 44125 and is currently estimated at $160,690, approximately $112 per square foot. 4921 E 106th St is a home located in Cuyahoga County with nearby schools including Garfield Heights High School, North Shore High School, and Trinity High School.
Ownership History
Date
Name
Owned For
Owner Type
Purchase Details
Closed on
Dec 29, 2009
Sold by
Silvestri Dominic
Bought by
Massey Shawn
Current Estimated Value
Purchase Details
Closed on
Feb 14, 2008
Sold by
Dornon Mervin and Dornon Cindy
Bought by
Massey Shawn M
Home Financials for this Owner
Home Financials are based on the most recent Mortgage that was taken out on this home.
Original Mortgage
$109,530
Interest Rate
6.11%
Mortgage Type
Purchase Money Mortgage
Purchase Details
Closed on
Jul 25, 2005
Sold by
Dornon Mervin
Bought by
Dornon Mervin and Dornon Cindy
Purchase Details
Closed on
Oct 31, 1991
Sold by
Helen Tesmer
Bought by
Dornon Mervin A
Purchase Details
Closed on
Nov 23, 1977
Sold by
Tesmer Frank and Tesmer Helen
Bought by
Helen Tesmer
Purchase Details
Closed on
Jan 1, 1975
Bought by
Tesmer Frank and Tesmer Helen
Create a Home Valuation Report for This Property
The Home Valuation Report is an in-depth analysis detailing your home's value as well as a comparison with similar homes in the area
Home Values in the Area
Average Home Value in this Area
Purchase History
| Date | Buyer | Sale Price | Title Company |
|---|---|---|---|
| Massey Shawn | $15,963 | None Available | |
| Massey Shawn M | $111,500 | Real Living Title Agency L | |
| Dornon Mervin | -- | Attorney | |
| Dornon Mervin A | $62,000 | -- | |
| Helen Tesmer | -- | -- | |
| Tesmer Frank | -- | -- |
Source: Public Records
Mortgage History
| Date | Status | Borrower | Loan Amount |
|---|---|---|---|
| Previous Owner | Massey Shawn M | $109,530 |
Source: Public Records
Tax History
| Year | Tax Paid | Tax Assessment Tax Assessment Total Assessment is a certain percentage of the fair market value that is determined by local assessors to be the total taxable value of land and additions on the property. | Land | Improvement |
|---|---|---|---|---|
| 2024 | $3,945 | $38,535 | $7,385 | $31,150 |
| 2023 | $2,931 | $26,250 | $5,040 | $21,210 |
| 2022 | $2,889 | $26,250 | $5,040 | $21,210 |
| 2021 | $3,052 | $26,250 | $5,040 | $21,210 |
| 2020 | $2,626 | $21,000 | $4,030 | $16,980 |
| 2019 | $2,602 | $60,000 | $11,500 | $48,500 |
| 2018 | $2,707 | $21,000 | $4,030 | $16,980 |
| 2017 | $2,566 | $19,390 | $3,220 | $16,170 |
| 2016 | $2,603 | $19,390 | $3,220 | $16,170 |
| 2015 | $2,865 | $19,390 | $3,220 | $16,170 |
| 2014 | $2,865 | $23,660 | $3,920 | $19,740 |
Source: Public Records
Map
Nearby Homes
- 4885 E 107th St
- 4905 E 108th St
- 4922 E 109th St
- 4902 E 109th St
- 10609 Wadsworth Ave
- 4923 E 109th St
- 4920 E 110th St
- 10800 Wadsworth Ave
- 10118 Russell Ave
- 11017 Vernon Ave
- 10105 Russell Ave
- 9717 David Rd
- 10609 Mccracken Blvd
- 9717 Alexander Rd
- 10201 Greenview Ave
- 11206 Park Heights Ave
- 10105 Greenview Ave
- 10916 Mccracken Rd
- 10217 Parkview Ave
- 11011 Wallingford Ave
- 4925 E 106th St
- 4917 E 106th St
- 4929 E 106th St
- 4911 E 106th St
- 4922 E 107th St
- 4924 E 107th St
- 4916 E 107th St
- 4909 E 106th St
- 4912 E 107th St
- 4930 E 107th St
- 4920 E 106th St
- 4926 E 106th St
- 4916 E 106th St
- 4908 E 107th St
- 4934 E 107th St
- 4905 E 106th St
- 4937 E 106th St
- 4912 E 106th St
- 4938 E 107th St
- 4906 E 107th St