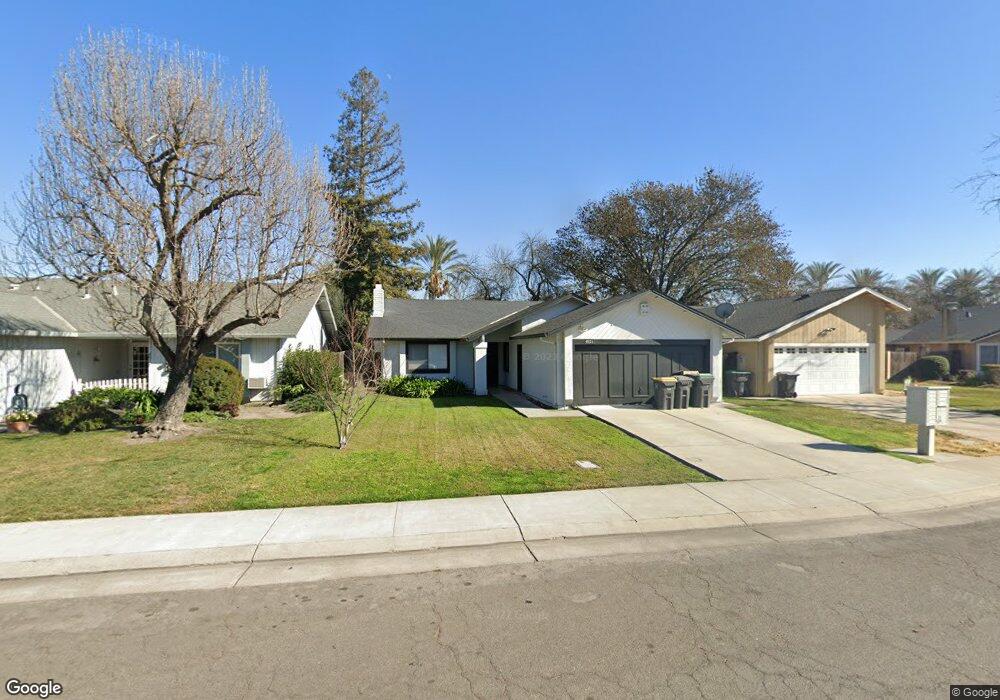
4921 Moss Creek Cir Stockton, CA 95219
Brookside NeighborhoodEstimated Value: $335,000 - $430,000
3
Beds
2
Baths
1,292
Sq Ft
$309/Sq Ft
Est. Value
About This Home
This home is located at 4921 Moss Creek Cir, Stockton, CA 95219 and is currently estimated at $399,455, approximately $309 per square foot. 4921 Moss Creek Cir is a home located in San Joaquin County with nearby schools including Claudia Landeen School, Sierra Middle School, and Lincoln High School.
Ownership History
Date
Name
Owned For
Owner Type
Purchase Details
Closed on
Sep 29, 2020
Sold by
Carrillo Valentin
Bought by
Carrillo Mayra M
Current Estimated Value
Home Financials for this Owner
Home Financials are based on the most recent Mortgage that was taken out on this home.
Original Mortgage
$238,500
Outstanding Balance
$212,133
Interest Rate
2.9%
Mortgage Type
New Conventional
Estimated Equity
$187,322
Purchase Details
Closed on
Nov 15, 2014
Sold by
Wooldridge Kerry S and Wooldridge Donna M
Bought by
2014 Wooldridge Family Trust
Purchase Details
Closed on
Mar 30, 2005
Sold by
Lobo Eugene R and Lobo Jeanne M
Bought by
Wooldridge Kerry S and Wooldridge Donna M
Home Financials for this Owner
Home Financials are based on the most recent Mortgage that was taken out on this home.
Original Mortgage
$260,000
Interest Rate
5.19%
Mortgage Type
Negative Amortization
Purchase Details
Closed on
Jul 29, 1996
Sold by
Lobo Eugene R
Bought by
Lobo Eugene R and Lobo Jeanne M
Create a Home Valuation Report for This Property
The Home Valuation Report is an in-depth analysis detailing your home's value as well as a comparison with similar homes in the area
Home Values in the Area
Average Home Value in this Area
Purchase History
| Date | Buyer | Sale Price | Title Company |
|---|---|---|---|
| Carrillo Mayra M | -- | Chicago Title Company | |
| Carrillo Mayra M | $318,000 | Chicago Title Company | |
| 2014 Wooldridge Family Trust | -- | None Available | |
| Wooldridge Kerry S | -- | Alliance Title Co | |
| Lobo Eugene R | -- | -- | |
| Lobo Eugene R | -- | -- |
Source: Public Records
Mortgage History
| Date | Status | Borrower | Loan Amount |
|---|---|---|---|
| Open | Carrillo Mayra M | $238,500 | |
| Previous Owner | Wooldridge Kerry S | $260,000 | |
| Closed | Wooldridge Kerry S | $32,467 |
Source: Public Records
Tax History Compared to Growth
Tax History
| Year | Tax Paid | Tax Assessment Tax Assessment Total Assessment is a certain percentage of the fair market value that is determined by local assessors to be the total taxable value of land and additions on the property. | Land | Improvement |
|---|---|---|---|---|
| 2025 | $4,156 | $344,212 | $97,418 | $246,794 |
| 2024 | $4,069 | $337,463 | $95,508 | $241,955 |
| 2023 | $4,039 | $330,847 | $93,636 | $237,211 |
| 2022 | $3,853 | $324,360 | $91,800 | $232,560 |
| 2021 | $3,803 | $318,000 | $90,000 | $228,000 |
| 2020 | $3,461 | $284,500 | $90,000 | $194,500 |
| 2019 | $3,472 | $284,500 | $90,000 | $194,500 |
| 2018 | $3,371 | $275,500 | $90,000 | $185,500 |
| 2017 | $3,178 | $259,000 | $104,000 | $155,000 |
| 2016 | $3,148 | $254,000 | $102,000 | $152,000 |
| 2015 | $2,771 | $220,000 | $88,000 | $132,000 |
| 2014 | $2,692 | $212,000 | $64,000 | $148,000 |
Source: Public Records
Map
Nearby Homes
- 3287 Amberfield Cir
- 3668 Whispering Creek Cir
- 4576 Winding River Cir Unit 1
- 3669 Whispering Creek Cir
- 3634 Whispering Creek Cir
- 3635 Hidden Brook Dr
- 4464 Mallard Creek Cir
- 4456 Mallard Creek Cir
- 4368 Boulder Creek Cir
- 5633 Brush Creek Dr
- 3591 Quail Lakes Dr Unit 295
- 3591 Quail Lakes Dr Unit 258
- 3591 Quail Lakes Dr Unit 133
- 3591 Quail Lakes Dr Unit 76
- 3591 Quail Lakes Dr Unit 166
- 3591 Quail Lakes Dr Unit 117
- 5029 Mallard Creek Ct
- 4273 Boulder Creek Cir
- 3742 Wood Duck Cir
- 2903 Raintree Ct
- 4917 Moss Creek Cir
- 4925 Moss Creek Cir
- 4909 Moss Creek Cir
- 4929 Moss Creek Cir
- 4918 Moss Creek Cir
- 4922 Moss Creek Cir
- 4914 Moss Creek Cir
- 4933 Moss Creek Cir
- 4910 Moss Creek Cir
- 4937 Moss Creek Cir
- 5083 Moss Creek Cir
- 4906 Moss Creek Cir
- 4946 Moss Creek Cir
- 4941 Moss Creek Cir
- 2930 Moss Creek Ct
- 5084 Moss Creek Cir
- 4945 Moss Creek Cir
- 5079 Moss Creek Cir
- 4950 Moss Creek Cir
- 2938 Moss Creek Ct