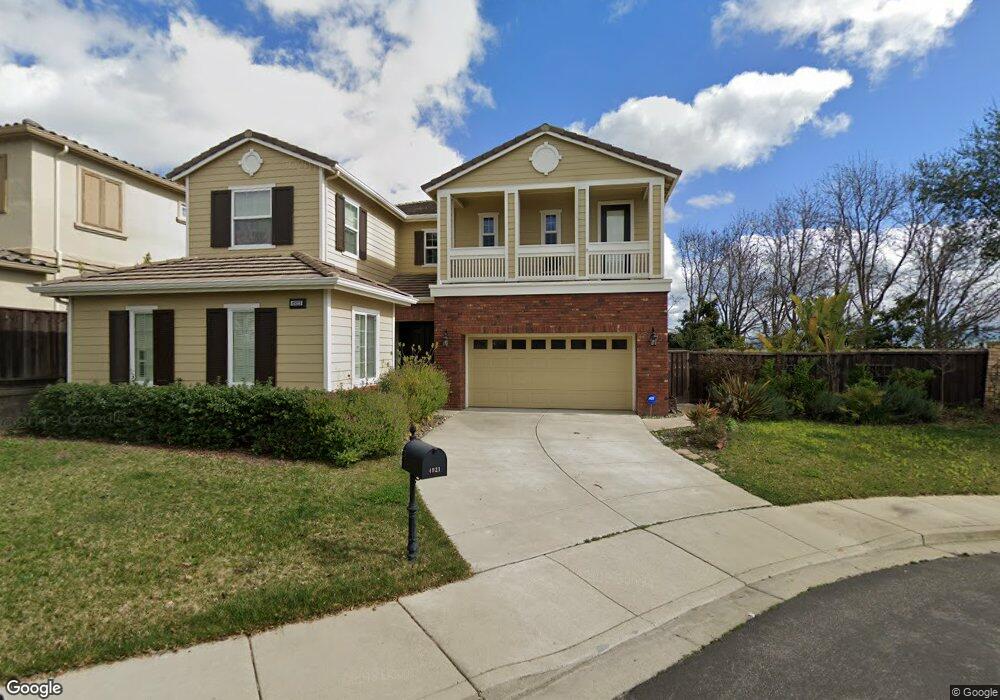
4921 Royal Pines Ct Dublin, CA 94568
Dublin Ranch NeighborhoodEstimated Value: $2,389,000 - $2,600,543
5
Beds
5
Baths
3,803
Sq Ft
$649/Sq Ft
Est. Value
About This Home
This home is located at 4921 Royal Pines Ct, Dublin, CA 94568 and is currently estimated at $2,469,386, approximately $649 per square foot. 4921 Royal Pines Ct is a home located in Alameda County with nearby schools including J.M. Amador Elementary School, Dublin High School, and The Quarry Lane School.
Ownership History
Date
Name
Owned For
Owner Type
Purchase Details
Closed on
Nov 22, 2015
Sold by
Smith Gregory M and Hasty William
Bought by
Wan Xuhui and Li Min
Current Estimated Value
Home Financials for this Owner
Home Financials are based on the most recent Mortgage that was taken out on this home.
Original Mortgage
$1,000,000
Outstanding Balance
$757,679
Interest Rate
2.75%
Mortgage Type
Adjustable Rate Mortgage/ARM
Estimated Equity
$1,711,707
Purchase Details
Closed on
Nov 5, 2013
Sold by
Pnmac Mortgage Opportunity Fund Investor
Bought by
Smith Gregory M and Hasty William L
Home Financials for this Owner
Home Financials are based on the most recent Mortgage that was taken out on this home.
Original Mortgage
$1,076,256
Interest Rate
4.18%
Mortgage Type
VA
Purchase Details
Closed on
May 17, 2013
Sold by
Singh Dalbag
Bought by
Pnmac Mortgage Opportunity Fund Investor
Purchase Details
Closed on
Sep 7, 2011
Sold by
Kaur Paramjit
Bought by
Singh Dalbag
Purchase Details
Closed on
Jul 24, 2006
Sold by
Singh Dalbag
Bought by
Singh Dalbag and Kaur Paramjit
Home Financials for this Owner
Home Financials are based on the most recent Mortgage that was taken out on this home.
Original Mortgage
$1,000,000
Interest Rate
6.25%
Mortgage Type
Purchase Money Mortgage
Purchase Details
Closed on
Apr 7, 2005
Sold by
Singh Dalbag
Bought by
Singh Dalbag and Kaur Paramjit
Home Financials for this Owner
Home Financials are based on the most recent Mortgage that was taken out on this home.
Original Mortgage
$1,000,000
Interest Rate
1%
Mortgage Type
New Conventional
Purchase Details
Closed on
Apr 4, 2005
Sold by
Cortes Jaime O and Cortes Maria D
Bought by
Singh Dalbag
Home Financials for this Owner
Home Financials are based on the most recent Mortgage that was taken out on this home.
Original Mortgage
$1,000,000
Interest Rate
1%
Mortgage Type
New Conventional
Purchase Details
Closed on
Mar 31, 2005
Sold by
Kaur Paramjit
Bought by
Singh Dalbag
Home Financials for this Owner
Home Financials are based on the most recent Mortgage that was taken out on this home.
Original Mortgage
$1,000,000
Interest Rate
1%
Mortgage Type
New Conventional
Purchase Details
Closed on
Oct 22, 2002
Sold by
Toll Ca Ii Lp
Bought by
Cortes Jaime O and Cortes Maria D
Home Financials for this Owner
Home Financials are based on the most recent Mortgage that was taken out on this home.
Original Mortgage
$498,500
Interest Rate
6.09%
Mortgage Type
Stand Alone First
Create a Home Valuation Report for This Property
The Home Valuation Report is an in-depth analysis detailing your home's value as well as a comparison with similar homes in the area
Home Values in the Area
Average Home Value in this Area
Purchase History
| Date | Buyer | Sale Price | Title Company |
|---|---|---|---|
| Wan Xuhui | $1,280,000 | Fidelity National Title Co | |
| Smith Gregory M | $1,060,000 | Fidelity National Title Co | |
| Pnmac Mortgage Opportunity Fund Investor | $975,000 | None Available | |
| Singh Dalbag | -- | Old Republic Title Company | |
| Singh Dalbag | -- | Fidelity National Title Co | |
| Singh Dalbag | -- | Fidelity National Title Co | |
| Singh Dalbag | -- | -- | |
| Singh Dalbag | $1,335,000 | Alliance Title Company | |
| Singh Dalbag | -- | Alliance Title Company | |
| Cortes Jaime O | $899,000 | Chicago Title Company |
Source: Public Records
Mortgage History
| Date | Status | Borrower | Loan Amount |
|---|---|---|---|
| Open | Wan Xuhui | $1,000,000 | |
| Previous Owner | Smith Gregory M | $1,076,256 | |
| Previous Owner | Singh Dalbag | $1,000,000 | |
| Previous Owner | Singh Dalbag | $1,000,000 | |
| Previous Owner | Cortes Jaime O | $498,500 |
Source: Public Records
Tax History Compared to Growth
Tax History
| Year | Tax Paid | Tax Assessment Tax Assessment Total Assessment is a certain percentage of the fair market value that is determined by local assessors to be the total taxable value of land and additions on the property. | Land | Improvement |
|---|---|---|---|---|
| 2025 | $19,657 | $1,508,224 | $454,567 | $1,060,657 |
| 2024 | $19,657 | $1,478,516 | $445,655 | $1,039,861 |
| 2023 | $19,454 | $1,456,396 | $436,919 | $1,019,477 |
| 2022 | $19,223 | $1,420,840 | $428,352 | $999,488 |
| 2021 | $19,064 | $1,392,845 | $419,953 | $979,892 |
| 2020 | $17,838 | $1,385,497 | $415,649 | $969,848 |
| 2019 | $17,873 | $1,358,335 | $407,500 | $950,835 |
| 2018 | $17,466 | $1,331,711 | $399,513 | $932,198 |
| 2017 | $17,245 | $1,305,600 | $391,680 | $913,920 |
| 2016 | $15,715 | $1,280,000 | $384,000 | $896,000 |
| 2015 | $13,387 | $1,106,178 | $324,353 | $781,825 |
| 2014 | $13,125 | $1,060,000 | $318,000 | $742,000 |
Source: Public Records
Map
Nearby Homes
- 4986 Grayhawk Ct
- 3005 Vittoria Loop
- 3105 Vittoria Loop
- 3135 Vittoria Loop
- 3956 Jordan Ranch Dr
- 3970 Jordan Ranch Dr
- 2371 Capistrello St
- 2528 Amantea Way
- 2848 E Cog Hill Terrace
- 2378 Carbondale Way
- 2336 Carbondale Way
- 4456 Sunset View Dr
- 4439 Sunset View Dr
- 4369 Table Mountain Rd
- 3056 Threecastles Way
- 3493 Capoterra Way
- 3391 Monaghan St
- 4228 Loyalton Rd
- 4287 Loyalton Rd
- 5636 N Dublin Ranch Dr
- 4937 Royal Pines Ct
- 4953 Royal Pines Ct
- 4969 Royal Pines Ct
- 4920 Royal Pines Ct
- 4936 Royal Pines Ct
- 4902 Royal Pines Ct
- 4952 Royal Pines Ct
- 4985 Royal Pines Ct
- 4968 Royal Pines Ct
- 4844 Stonehaven Ln
- 4830 Stonehaven Ln
- 4984 Royal Pines Ct
- 4858 Stonehaven Ln
- 4923 Grayhawk Ct
- 4939 Grayhawk Ct
- 4907 Grayhawk Ct
- 4951 Grayhawk Ct
- 4872 Stonehaven Ln
- 4973 Grayhawk Ct
- 2780 S Kilbride Ln