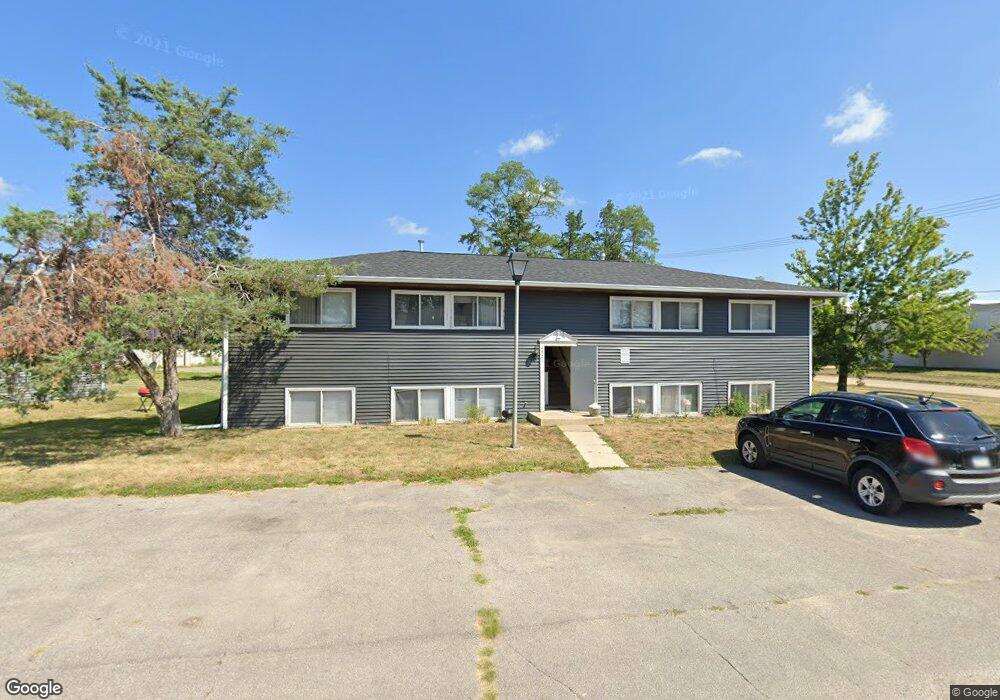
4921 Tama St Unit 1 Marion, IA 52302
Estimated Value: $107,000 - $265,869
2
Beds
--
Bath
864
Sq Ft
$208/Sq Ft
Est. Value
About This Home
This home is located at 4921 Tama St Unit 1, Marion, IA 52302 and is currently estimated at $179,717, approximately $208 per square foot. 4921 Tama St Unit 1 is a home located in Linn County with nearby schools including Novak Elementary School, Oak Ridge School, and Linn-Mar High School.
Ownership History
Date
Name
Owned For
Owner Type
Purchase Details
Closed on
Feb 23, 2024
Sold by
Finnick Investments Llc
Bought by
Nguyen Enterprise Roofing And Construction Ll
Current Estimated Value
Home Financials for this Owner
Home Financials are based on the most recent Mortgage that was taken out on this home.
Original Mortgage
$176,000
Outstanding Balance
$172,884
Interest Rate
6.6%
Mortgage Type
New Conventional
Estimated Equity
$6,833
Purchase Details
Closed on
Sep 30, 2021
Sold by
Green Acre Developments Inc
Bought by
Finnick Investments Llc
Home Financials for this Owner
Home Financials are based on the most recent Mortgage that was taken out on this home.
Original Mortgage
$182,000
Interest Rate
2.8%
Mortgage Type
Purchase Money Mortgage
Create a Home Valuation Report for This Property
The Home Valuation Report is an in-depth analysis detailing your home's value as well as a comparison with similar homes in the area
Home Values in the Area
Average Home Value in this Area
Purchase History
| Date | Buyer | Sale Price | Title Company |
|---|---|---|---|
| Nguyen Enterprise Roofing And Construction Ll | $220,000 | None Listed On Document | |
| Nguyen Enterprise Roofing And Construction Ll | $220,000 | None Listed On Document | |
| Finnick Investments Llc | $228,000 | None Available |
Source: Public Records
Mortgage History
| Date | Status | Borrower | Loan Amount |
|---|---|---|---|
| Open | Nguyen Enterprise Roofing And Construction Ll | $176,000 | |
| Closed | Nguyen Enterprise Roofing And Construction Ll | $176,000 | |
| Previous Owner | Finnick Investments Llc | $182,000 |
Source: Public Records
Tax History Compared to Growth
Tax History
| Year | Tax Paid | Tax Assessment Tax Assessment Total Assessment is a certain percentage of the fair market value that is determined by local assessors to be the total taxable value of land and additions on the property. | Land | Improvement |
|---|---|---|---|---|
| 2025 | $1,068 | $75,400 | $6,300 | $69,100 |
| 2024 | $1,056 | $56,800 | $6,300 | $50,500 |
| 2023 | $1,056 | $56,800 | $6,300 | $50,500 |
| 2022 | $1,006 | $47,600 | $6,300 | $41,300 |
| 2021 | $1,000 | $47,600 | $6,300 | $41,300 |
| 2020 | $1,000 | $44,400 | $6,300 | $38,100 |
| 2019 | $928 | $44,400 | $6,300 | $38,100 |
| 2018 | $892 | $41,100 | $6,300 | $34,800 |
| 2017 | $834 | $38,600 | $6,300 | $32,300 |
| 2016 | $834 | $38,600 | $6,300 | $32,300 |
| 2015 | $830 | $38,600 | $6,300 | $32,300 |
| 2014 | $830 | $38,600 | $6,300 | $32,300 |
| 2013 | $792 | $38,600 | $6,300 | $32,300 |
Source: Public Records
Map
Nearby Homes
- 850 Kerry Ln SE Unit 23
- 869 Kerry Ln SE Unit 46
- 955 Bridgit Ln SE
- 849 Kerry Ln SE Unit 58
- 809 Kerry Ln SE Unit 72
- 809 Kerry Ln SE Unit 66
- 1005 Bridgit Ct SE Unit 7
- 1015 Woodland Heights Ct SE Unit 12
- 340 Cemar Ct
- 4410 Maureen Ct SE Unit 189
- 203 Cemar Ct
- 1013 Blairs Ferry R
- 6030 Northridge Point SE
- 1145 Blairs Ferry Rd
- 5030 Charter Oak Ln SE
- 155 Grand Ave
- 112 Merion Blvd
- 103 Merion Blvd
- 4021 Charter Oak Ln SE
- 305 Valleyview Dr
- 4921 Tama St
- 4921 Tama St Unit 4
- 4921 Tama St Unit 3
- 4921 Tama St Unit 2
- 120 Collins Rd SE
- 4961 Tama St
- 4837 1st Ave SE Unit 104
- 4837 1st Ave SE Unit 201
- 4837 1st Ave SE Unit 100
- 4837 1st Ave SE Unit 205
- 4837 1st Ave SE Unit 206
- 4837 1st Ave SE Unit 203
- 4837 1st Ave SE Unit 200
- 810 Bridgit Ln SE Unit 5
- 810 Bridgit Ln SE Unit 4
- 810 Bridgit Ln SE Unit 3
- 810 Bridgit Ln SE Unit 2
- 810 Bridgit Ln SE Unit 1
- 810 Bridgit Ln SE Unit 6
- 810* Bridgit Ln SE