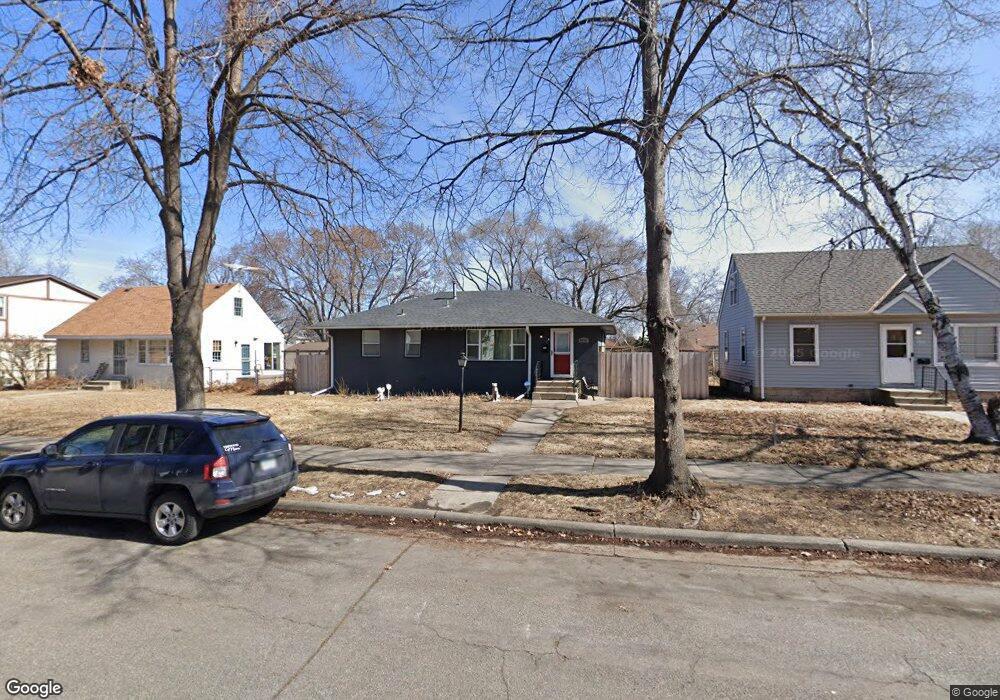
4922 Logan Ave N Minneapolis, MN 55430
Shingle Creek NeighborhoodEstimated Value: $286,000 - $303,948
4
Beds
2
Baths
1,040
Sq Ft
$281/Sq Ft
Est. Value
About This Home
This home is located at 4922 Logan Ave N, Minneapolis, MN 55430 and is currently estimated at $292,237, approximately $280 per square foot. 4922 Logan Ave N is a home located in Hennepin County with nearby schools including Jenny Lind Elementary School, Olson Middle School, and KIPP North Star Primary.
Ownership History
Date
Name
Owned For
Owner Type
Purchase Details
Closed on
Jan 31, 2020
Sold by
Vue Alexander
Bought by
Mounger Jacque A
Current Estimated Value
Home Financials for this Owner
Home Financials are based on the most recent Mortgage that was taken out on this home.
Original Mortgage
$207,299
Outstanding Balance
$184,035
Interest Rate
3.74%
Mortgage Type
New Conventional
Estimated Equity
$108,202
Purchase Details
Closed on
Sep 7, 2017
Sold by
Vue Hue Pao
Bought by
Vue Alexander
Purchase Details
Closed on
Apr 11, 2011
Sold by
Us Bank Na
Bought by
Vu Luke Nue
Purchase Details
Closed on
Aug 10, 2010
Sold by
May V Lee
Bought by
Us Bank Na
Purchase Details
Closed on
Oct 1, 2004
Sold by
Pearson Steven K and Pearson Shana M
Bought by
Lee May Y and Lee Hawaii
Purchase Details
Closed on
Jul 23, 1998
Sold by
Barsky Helen
Bought by
Pearson Steven K and Pearson Shana M
Create a Home Valuation Report for This Property
The Home Valuation Report is an in-depth analysis detailing your home's value as well as a comparison with similar homes in the area
Home Values in the Area
Average Home Value in this Area
Purchase History
| Date | Buyer | Sale Price | Title Company |
|---|---|---|---|
| Mounger Jacque A | $216,500 | Titlesmart Inc | |
| Vue Alexander | -- | None Available | |
| Vu Luke Nue | $55,000 | -- | |
| Us Bank Na | $190,733 | -- | |
| Lee May Y | $170,400 | -- | |
| Pearson Steven K | $84,900 | -- |
Source: Public Records
Mortgage History
| Date | Status | Borrower | Loan Amount |
|---|---|---|---|
| Open | Mounger Jacque A | $207,299 |
Source: Public Records
Tax History Compared to Growth
Tax History
| Year | Tax Paid | Tax Assessment Tax Assessment Total Assessment is a certain percentage of the fair market value that is determined by local assessors to be the total taxable value of land and additions on the property. | Land | Improvement |
|---|---|---|---|---|
| 2024 | $3,785 | $276,000 | $52,000 | $224,000 |
| 2023 | $3,557 | $285,000 | $52,000 | $233,000 |
| 2022 | $2,930 | $260,000 | $52,000 | $208,000 |
| 2021 | $2,466 | $213,000 | $19,000 | $194,000 |
| 2020 | $2,449 | $185,000 | $21,900 | $163,100 |
| 2019 | $2,139 | $170,500 | $19,800 | $150,700 |
| 2018 | $1,864 | $144,500 | $19,800 | $124,700 |
| 2017 | $1,752 | $115,000 | $18,000 | $97,000 |
| 2016 | $1,737 | $110,500 | $18,000 | $92,500 |
| 2015 | $1,649 | $100,000 | $18,000 | $82,000 |
| 2014 | -- | $94,500 | $18,000 | $76,500 |
Source: Public Records
Map
Nearby Homes
- 4918 Morgan Ave N
- 4914 Oliver Ave N
- 5106 Knox Ave N
- 5118 James Ave N
- 4920 Humboldt Ln
- 5136 James Ave N
- 4921 Penn Ave N
- 5135 Irving Ave N
- 5146 Newton Ave N
- 5101 Fremont Ave N
- 5136 Queen Ave N
- 5239 Humboldt Ave N
- 1115 50th Ave N
- 4625 Oliver Ave N
- 5307 Newton Ave N
- 5113 Dupont Ave N
- 5252 Queen Ave N
- 5253 Queen Ave N
- 4523 James Ave N
- 4742 Dupont Ave N
- 4916 Logan Ave N
- 4926 Logan Ave N
- 4910 Logan Ave N
- 4934 Logan Ave N
- 4923 Knox Ave N
- 4906 Logan Ave N
- 4917 Knox Ave N
- 4929 Knox Ave N
- 4911 Knox Ave N
- 4940 Logan Ave N
- 4935 Knox Ave N
- 4900 Logan Ave N
- 4923 Logan Ave N
- 4927 Logan Ave N
- 4917 Logan Ave N
- 4907 Knox Ave N
- 4931 Logan Ave N
- 4911 Logan Ave N
- 4941 Knox Ave N
- 4935 Logan Ave N