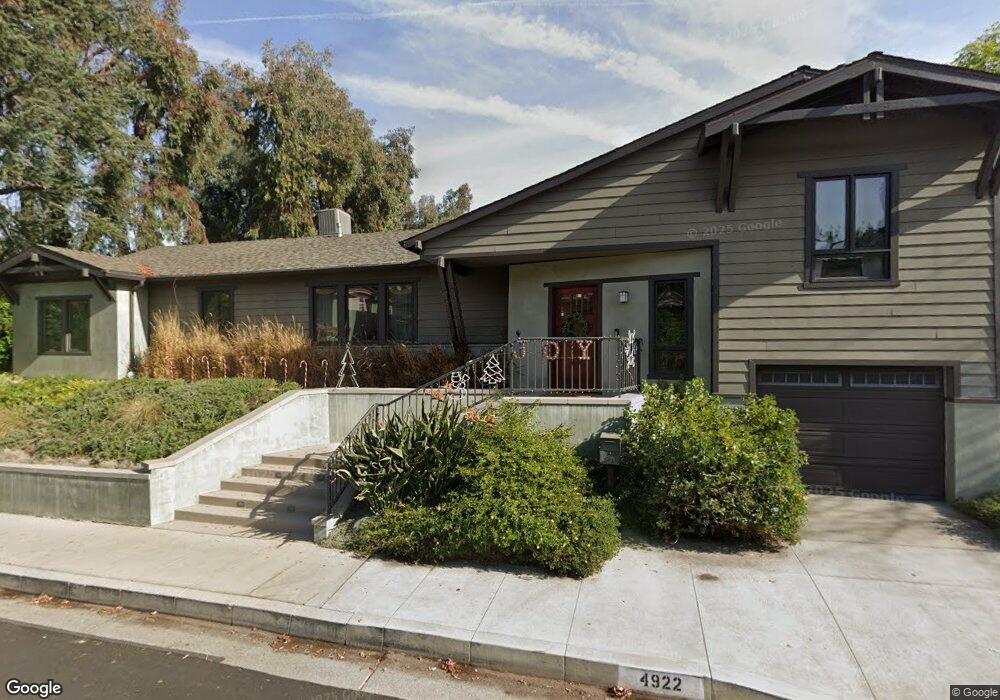
4922 San Feliciano Dr Woodland Hills, CA 91364
Estimated Value: $1,222,314 - $1,568,000
5
Beds
3
Baths
2,612
Sq Ft
$554/Sq Ft
Est. Value
About This Home
This home is located at 4922 San Feliciano Dr, Woodland Hills, CA 91364 and is currently estimated at $1,448,079, approximately $554 per square foot. 4922 San Feliciano Dr is a home located in Los Angeles County with nearby schools including Woodland Hills Academy, Woodland Hills Elementary Charter For Enriched Studies, and Serrania Charter For Enriched Studies.
Ownership History
Date
Name
Owned For
Owner Type
Purchase Details
Closed on
May 19, 2003
Sold by
Hughey Stephen M and Cifola Barbara
Bought by
Hughey Stephen
Current Estimated Value
Home Financials for this Owner
Home Financials are based on the most recent Mortgage that was taken out on this home.
Original Mortgage
$260,000
Outstanding Balance
$112,672
Interest Rate
5.75%
Mortgage Type
Purchase Money Mortgage
Estimated Equity
$1,335,407
Purchase Details
Closed on
Feb 24, 2000
Sold by
Trust Sherman Ray I And Jeanne Trs Sherm
Bought by
Hughey Stephen M
Home Financials for this Owner
Home Financials are based on the most recent Mortgage that was taken out on this home.
Original Mortgage
$153,300
Interest Rate
8.38%
Mortgage Type
Stand Alone First
Purchase Details
Closed on
Mar 14, 1994
Sold by
Sherman Ray I and Sherman Jeanne
Bought by
Sherman Ray I
Create a Home Valuation Report for This Property
The Home Valuation Report is an in-depth analysis detailing your home's value as well as a comparison with similar homes in the area
Home Values in the Area
Average Home Value in this Area
Purchase History
| Date | Buyer | Sale Price | Title Company |
|---|---|---|---|
| Hughey Stephen | -- | Fidelity National Title Co | |
| Hughey Stephen M | $219,000 | American Title Ins Co | |
| Sherman Ray I | -- | -- |
Source: Public Records
Mortgage History
| Date | Status | Borrower | Loan Amount |
|---|---|---|---|
| Open | Hughey Stephen | $260,000 | |
| Closed | Hughey Stephen M | $153,300 | |
| Closed | Hughey Stephen M | $43,800 |
Source: Public Records
Tax History Compared to Growth
Tax History
| Year | Tax Paid | Tax Assessment Tax Assessment Total Assessment is a certain percentage of the fair market value that is determined by local assessors to be the total taxable value of land and additions on the property. | Land | Improvement |
|---|---|---|---|---|
| 2025 | $6,637 | $539,632 | $269,266 | $270,366 |
| 2024 | $6,637 | $529,052 | $263,987 | $265,065 |
| 2023 | $6,511 | $518,679 | $258,811 | $259,868 |
| 2022 | $6,231 | $508,510 | $253,737 | $254,773 |
| 2021 | $6,143 | $498,540 | $248,762 | $249,778 |
| 2019 | $5,960 | $483,755 | $241,385 | $242,370 |
| 2018 | $5,892 | $474,270 | $236,652 | $237,618 |
| 2016 | $5,595 | $455,855 | $227,463 | $228,392 |
| 2015 | $5,514 | $449,009 | $224,047 | $224,962 |
| 2014 | $5,535 | $440,215 | $219,659 | $220,556 |
Source: Public Records
Map
Nearby Homes
- 22051 San Miguel St
- 22218 San Miguel St
- 22025 De la Osa St
- 22037 Ybarra Rd
- 4976 Llano Dr
- 4996 Llano Dr
- 4841 Don Pio Dr
- 4944 Don Pio Dr
- 22263 Flanco Rd
- 22002 Ybarra Rd
- 5099 Llano Dr
- 21907 De la Osa St
- 21914 Velicata St
- 22015 Independencia St
- 4981 Llano Dr
- 22297 Buena Ventura St
- 22261 Ybarra Rd
- 5111 San Feliciano Dr
- 4616 Coyle Place
- 22051 Mulholland Way
- 22126 Providencia St
- 22120 Providencia St
- 4906 San Feliciano Dr
- 22127 Dumetz Rd
- 22116 Providencia St
- 4917 San Feliciano Dr
- 22121 Dumetz Rd
- 22133 Providencia St
- 4925 San Feliciano Dr
- 22127 Providencia St
- 22117 Dumetz Rd
- 22110 Providencia St
- 22121 Providencia St
- 4931 San Feliciano Dr
- 4905 San Feliciano Dr
- 22117 Providencia St
- 22111 Dumetz Rd
- 4901 San Feliciano Dr
- 22106 Providencia St
- 4943 San Feliciano Dr