4923 Blue Creek Rd Lynnville, TN 38472
Estimated payment $6,975/month
About This Home
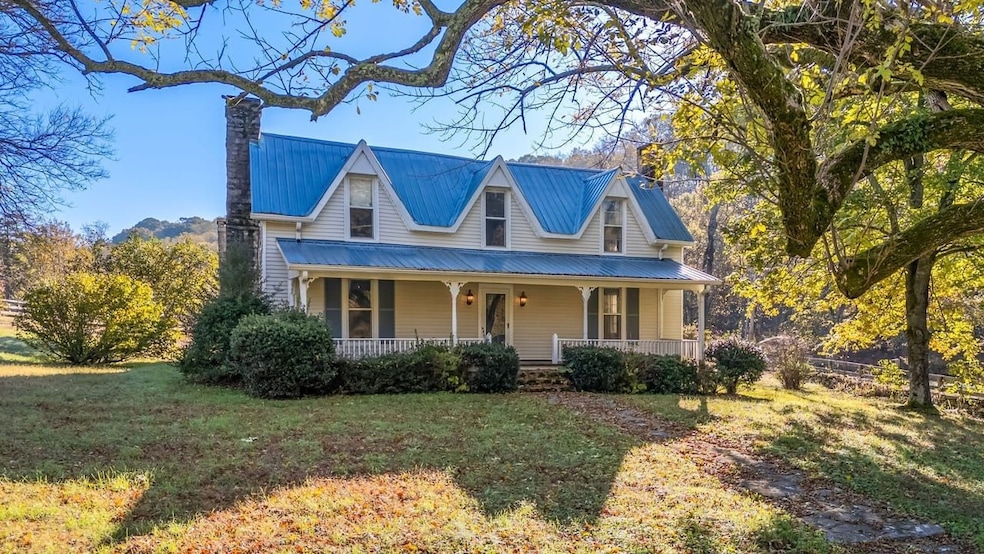
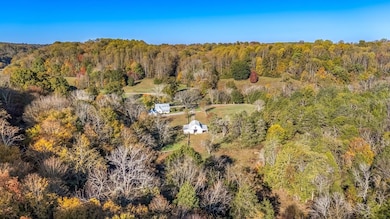
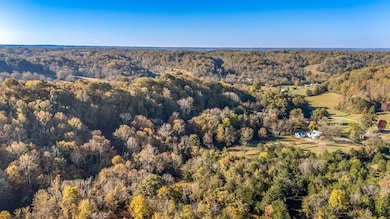
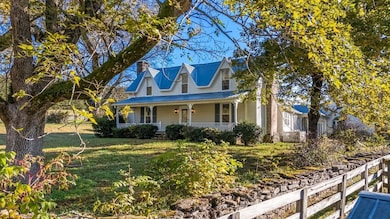
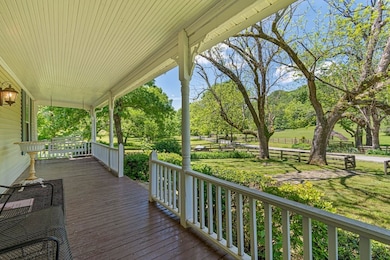
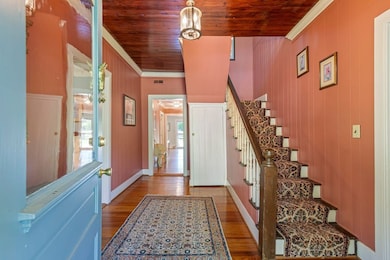
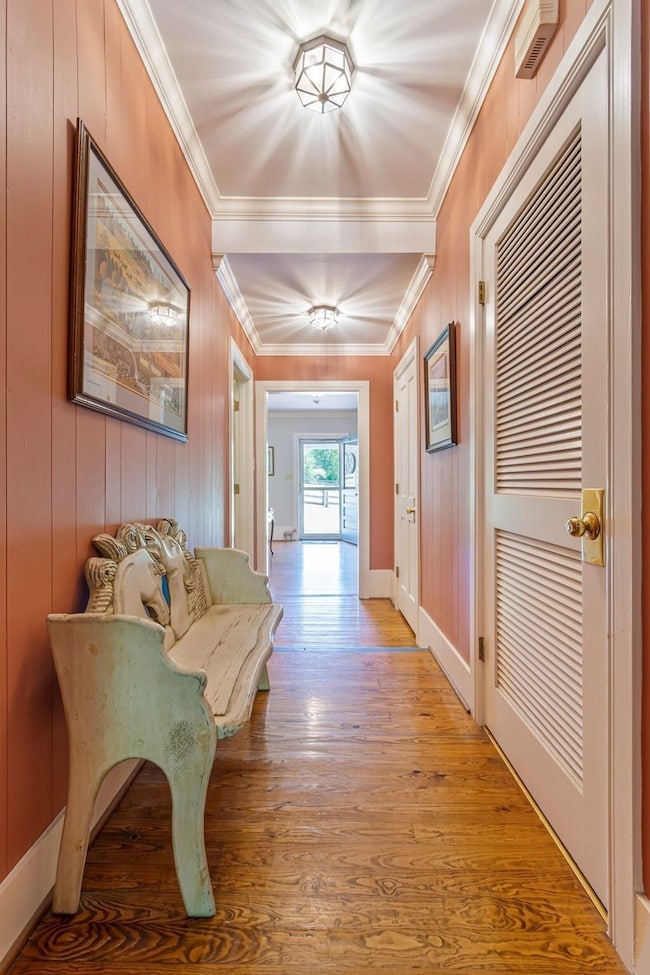
Set across 44 rolling acres, this pre-1900 farmhouse exudes timeless charm and character. Historic detailsHeart Pine floors and tongue-and-groove ceilingsunderscore its nostalgic appeal. The property is well-suited for horses and other animals, featuring a 4-stall barn with electric and water, three paddocks, and two pastures. Whether you’re seeking a quiet escape from city life, a simpler way of living, or the fulfillment of owning a working farm, this sanctuary delivers. Steeped in history and offering generous space for both people and livestock to roam, it’s a true gem for those drawn to a rustic yet refined lifestyle. Conveniently located just 15 minutes from Soda Pop Junction and the historic shops on downtown Lynnville’s square, 45 minutes to downtown Franklin, and about an hour to Nashville.

Home Details
Home Type
- Single Family
Bedrooms and Bathrooms
- 3 Bedrooms
Horse Facilities and Amenities
- Horses Allowed On Property
Map
Home Values in the Area
Average Home Value in this Area
Tax History
| Year | Tax Paid | Tax Assessment Tax Assessment Total Assessment is a certain percentage of the fair market value that is determined by local assessors to be the total taxable value of land and additions on the property. | Land | Improvement |
|---|---|---|---|---|
| 2025 | $1,958 | $98,575 | $0 | $0 |
| 2024 | $1,958 | $98,575 | $11,250 | $87,325 |
| 2023 | $1,958 | $98,575 | $11,250 | $87,325 |
| 2022 | $1,958 | $98,575 | $11,250 | $87,325 |
| 2021 | $1,978 | $70,025 | $8,525 | $61,500 |
| 2020 | $1,978 | $70,025 | $8,525 | $61,500 |
| 2019 | $1,503 | $68,625 | $8,525 | $60,100 |
| 2018 | $1,503 | $53,200 | $8,525 | $44,675 |
| 2017 | $1,503 | $53,200 | $8,525 | $44,675 |
| 2016 | $1,512 | $50,900 | $8,075 | $42,825 |
| 2015 | $1,410 | $50,900 | $8,075 | $42,825 |
| 2014 | $1,410 | $50,883 | $0 | $0 |
Property History
| Date | Event | Price | List to Sale | Price per Sq Ft | Prior Sale |
|---|---|---|---|---|---|
| 11/03/2025 11/03/25 | Price Changed | $1,295,000 | 0.0% | $447 / Sq Ft | |
| 11/03/2025 11/03/25 | For Sale | $1,295,000 | -13.4% | $447 / Sq Ft | |
| 05/16/2025 05/16/25 | For Sale | $1,495,000 | +87.1% | $516 / Sq Ft | |
| 09/04/2019 09/04/19 | Sold | $799,000 | -0.1% | $276 / Sq Ft | View Prior Sale |
| 08/19/2019 08/19/19 | Pending | -- | -- | -- | |
| 08/19/2019 08/19/19 | For Sale | $799,900 | -- | $276 / Sq Ft |
Purchase History
| Date | Type | Sale Price | Title Company |
|---|---|---|---|
| Cash Sale Deed | $799,000 | None Available | |
| Deed | $110,000 | -- | |
| Deed | $35,000 | -- | |
| Deed | $140,000 | -- | |
| Deed | $233,000 | -- | |
| Deed | $58,000 | -- | |
| Deed | $105,000 | -- | |
| Deed | -- | -- |
Mortgage History
| Date | Status | Loan Amount | Loan Type |
|---|---|---|---|
| Previous Owner | $75,000 | No Value Available |
- 3580 Blue Creek Rd
- 3186 Jett Rd
- 3180 Jett Rd
- 2533 Otis Fowler Rd
- 2846 Fuller Hollow Rd
- 9438 Lewisburg Hwy E
- 2165 Claude Fox Rd
- 2713 Mcconnell Rd
- 2337 Claude Fox Rd
- 300 Daytona Dr
- 1367 Diana Rd
- 315 Daytona Dr
- 121 Talladega Way
- 635 Bristol Run
- 430 Daytona Dr
- 620 Bristol Run
- 307 Front View St
- 0 Simmons Ridge Rd
- 2121 Lynnville Hwy
- 208 S Mulberry St
- 425 Centennial Ave
- 218 Mackenzie Way
- 2050 Lewisburg Hwy Unit C
- 314 Preston Ave
- 105 Curt Alsup Way
- 143 Ragsdale Ln
- 951 W Ellington Pkwy
- 341 S Ellington Pkwy
- 1404 Prescott Ln
- 702 E Jefferson St
- 1413 Prescott Ln
- 100 Somerset Ln
- 140 Landon Ln
- 3019 Cambridge Ct
- 437 E Jefferson St Unit 437439
- 227 N 1st St
- 123 S Sam Davis Ave Unit 4
- 123 S Sam Davis Ave Unit 5
- 118 N 3rd St Unit 1
- 219 W Flower St Unit C1