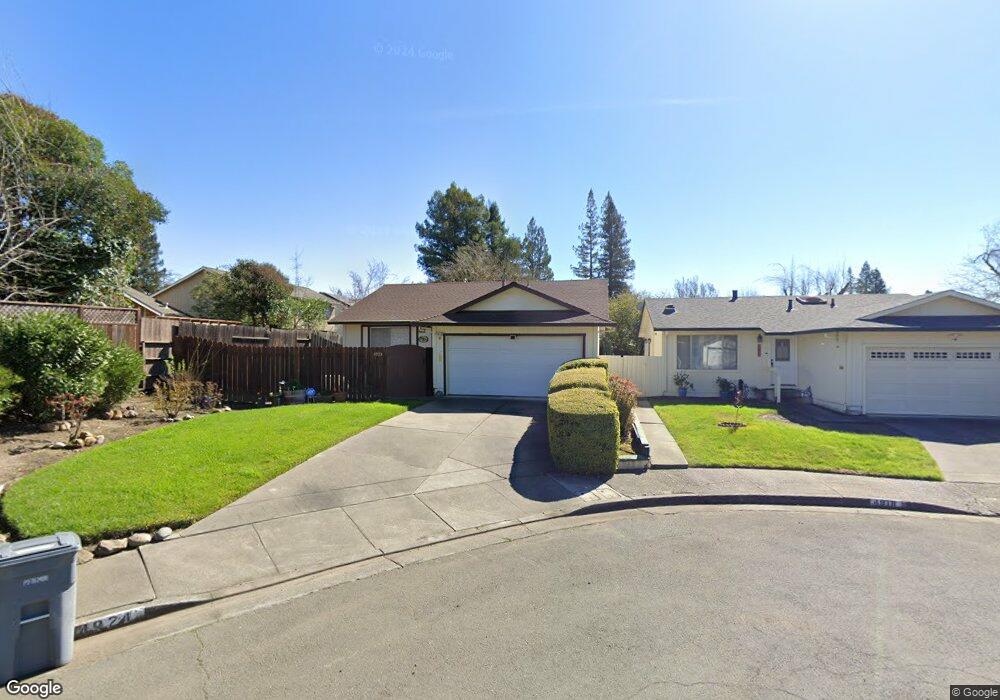
4924 Oak Park Way Santa Rosa, CA 95409
Estimated Value: $532,000 - $681,000
3
Beds
2
Baths
1,110
Sq Ft
$521/Sq Ft
Est. Value
About This Home
This home is located at 4924 Oak Park Way, Santa Rosa, CA 95409 and is currently estimated at $578,220, approximately $520 per square foot. 4924 Oak Park Way is a home located in Sonoma County with nearby schools including Rincon Valley Middle School, Maria Carrillo High School, and Binkley Elementary Charter School.
Ownership History
Date
Name
Owned For
Owner Type
Purchase Details
Closed on
Jul 28, 2020
Sold by
Tilden Gilda Y
Bought by
Tilden Gilda Y and Gilda Y Tilden Revocable Inter
Current Estimated Value
Purchase Details
Closed on
Sep 23, 2005
Sold by
Tilden Gilda and Tilden Gilda Y
Bought by
Tilden Gilda
Home Financials for this Owner
Home Financials are based on the most recent Mortgage that was taken out on this home.
Original Mortgage
$121,500
Outstanding Balance
$64,471
Interest Rate
5.72%
Mortgage Type
New Conventional
Estimated Equity
$513,749
Purchase Details
Closed on
Jun 4, 1998
Sold by
Lesser Jacqueline
Bought by
Tilden Gilda Y
Home Financials for this Owner
Home Financials are based on the most recent Mortgage that was taken out on this home.
Original Mortgage
$118,000
Interest Rate
7.17%
Create a Home Valuation Report for This Property
The Home Valuation Report is an in-depth analysis detailing your home's value as well as a comparison with similar homes in the area
Home Values in the Area
Average Home Value in this Area
Purchase History
| Date | Buyer | Sale Price | Title Company |
|---|---|---|---|
| Tilden Gilda Y | -- | None Available | |
| Tilden Gilda | -- | North American Title Co | |
| Tilden Gilda Y | $69,000 | North American Title Co |
Source: Public Records
Mortgage History
| Date | Status | Borrower | Loan Amount |
|---|---|---|---|
| Open | Tilden Gilda | $121,500 | |
| Closed | Tilden Gilda Y | $118,000 |
Source: Public Records
Tax History Compared to Growth
Tax History
| Year | Tax Paid | Tax Assessment Tax Assessment Total Assessment is a certain percentage of the fair market value that is determined by local assessors to be the total taxable value of land and additions on the property. | Land | Improvement |
|---|---|---|---|---|
| 2025 | $1,446 | $130,204 | $26,034 | $104,170 |
| 2024 | $1,446 | $127,652 | $25,524 | $102,128 |
| 2023 | $1,446 | $125,150 | $25,024 | $100,126 |
| 2022 | $1,333 | $122,697 | $24,534 | $98,163 |
| 2021 | $1,306 | $120,292 | $24,053 | $96,239 |
| 2020 | $1,300 | $119,060 | $23,807 | $95,253 |
| 2019 | $1,287 | $116,727 | $23,341 | $93,386 |
| 2018 | $1,278 | $114,439 | $22,884 | $91,555 |
| 2017 | $1,254 | $112,196 | $22,436 | $89,760 |
| 2016 | $1,230 | $109,997 | $21,997 | $88,000 |
| 2015 | $1,193 | $108,346 | $21,667 | $86,679 |
| 2014 | $1,149 | $106,225 | $21,243 | $84,982 |
Source: Public Records
Map
Nearby Homes
- 311 Algiers Ct
- 5015 Charmian Dr
- 537 Emerald Park Ct
- 305 Simone Place N
- 61 Coronado Cir
- 66 Coronado Cir
- 164 Brookview Ct
- 103 Glenoak Ct
- 5020 Roma St
- 71 Oakcreek Ct
- 29 Coronado Cir
- 52 Oakstone Ct Unit 52
- 5086 Charmian Dr
- 48 Shadyleaf Ct
- 5209 San Luis Ave
- 31 Springhill Ct
- 28 Springhill Ct
- 206 Indian Creek Dr
- 16 Redwood Ct Unit 55
- 4705 Culebra Way
- 4918 Oak Park Way
- 441 Tanglewood Ct
- 437 Tanglewood Ct
- 445 Tanglewood Ct
- 4910 Oak Park Way
- 433 Tanglewood Ct
- 405 Tanglewood Ct
- 409 Tanglewood Ct
- 429 Tanglewood Ct
- 401 Tanglewood Ct
- 1014 Jack London Dr
- 4911 Oak Park Way
- 4919 Oak Park Way
- 4927 Oak Park Way
- 1020 Jack London Dr
- 1010 Jack London Dr
- 4935 Oak Park Way
- 413 Tanglewood Ct
- 440 Tanglewood Ct
- 444 Tanglewood Ct