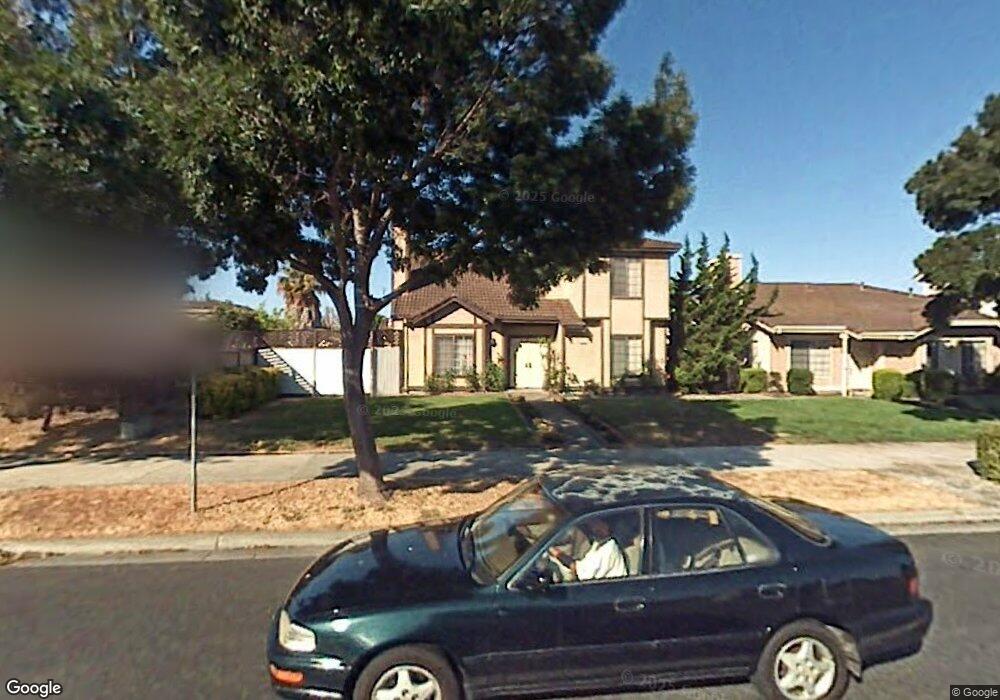
4925 Deep Creek Rd Fremont, CA 94555
Ardenwood NeighborhoodEstimated Value: $1,515,000 - $1,836,000
3
Beds
3
Baths
1,750
Sq Ft
$947/Sq Ft
Est. Value
About This Home
This home is located at 4925 Deep Creek Rd, Fremont, CA 94555 and is currently estimated at $1,657,609, approximately $947 per square foot. 4925 Deep Creek Rd is a home located in Alameda County with nearby schools including Ardenwood Elementary, Thornton Middle School, and American High School.
Ownership History
Date
Name
Owned For
Owner Type
Purchase Details
Closed on
Aug 10, 2010
Sold by
Ho Philomena and Ho Philomena Lai Ling
Bought by
Ho Philomena and Philomena Ho Trust
Current Estimated Value
Purchase Details
Closed on
Jul 8, 2010
Sold by
Ho Yui Tung
Bought by
Ho Philomena Lai Ling
Create a Home Valuation Report for This Property
The Home Valuation Report is an in-depth analysis detailing your home's value as well as a comparison with similar homes in the area
Home Values in the Area
Average Home Value in this Area
Purchase History
| Date | Buyer | Sale Price | Title Company |
|---|---|---|---|
| Ho Philomena | -- | None Available | |
| Ho Philomena Lai Ling | -- | None Available |
Source: Public Records
Tax History Compared to Growth
Tax History
| Year | Tax Paid | Tax Assessment Tax Assessment Total Assessment is a certain percentage of the fair market value that is determined by local assessors to be the total taxable value of land and additions on the property. | Land | Improvement |
|---|---|---|---|---|
| 2025 | $5,150 | $396,446 | $121,034 | $282,412 |
| 2024 | $5,150 | $388,537 | $118,661 | $276,876 |
| 2023 | $4,997 | $387,782 | $116,335 | $271,447 |
| 2022 | $4,913 | $373,179 | $114,054 | $266,125 |
| 2021 | $4,868 | $365,726 | $111,818 | $260,908 |
| 2020 | $4,825 | $368,905 | $110,672 | $258,233 |
| 2019 | $4,772 | $361,672 | $108,502 | $253,170 |
| 2018 | $4,676 | $354,582 | $106,375 | $248,207 |
| 2017 | $4,559 | $347,631 | $104,290 | $243,341 |
| 2016 | $4,471 | $340,816 | $102,245 | $238,571 |
| 2015 | $4,403 | $335,696 | $100,709 | $234,987 |
| 2014 | $4,320 | $329,122 | $98,737 | $230,385 |
Source: Public Records
Map
Nearby Homes
- 4744 Touchstone Terrace
- 5301 Shamrock Common
- 4512 Macbeth Ave
- 34648 Musk Terrace
- 34565 Pueblo Terrace
- 34607 Pueblo Terrace
- 34627 Pueblo Terrace
- 5220 Fairbanks Common
- 5176 Tacoma Common
- 34198 Tony Terrace
- 5308 Tacoma Common
- 34768 Swain Common
- 4243 Nerissa Cir
- 4141 Deep Creek Rd Unit 137
- 5621 Via Lugano
- 34579 Bluestone Common
- 34192 Firenze Terrace
- 33018 Soquel St
- 34656 Greenstone Common
- 32945 Regents Blvd
- 4921 Deep Creek Rd
- 4911 Paseo Padre Pkwy
- 4919 Paseo Padre Pkwy
- 4914 Montague Ave
- 4917 Deep Creek Rd
- 4927 Paseo Padre Pkwy
- 33997 Capulet Cir
- 4910 Montague Ave
- 4913 Deep Creek Rd
- 4933 Paseo Padre Pkwy
- 4906 Montague Ave
- 4909 Deep Creek Rd
- 4947 Paseo Padre Pkwy
- 33993 Capulet Cir
- 4918 Deep Creek Rd
- 4926 Deep Creek Rd
- 4912 Deep Creek Rd
- 4902 Montague Ave
- 4930 Deep Creek Rd
- 4905 Deep Creek Rd