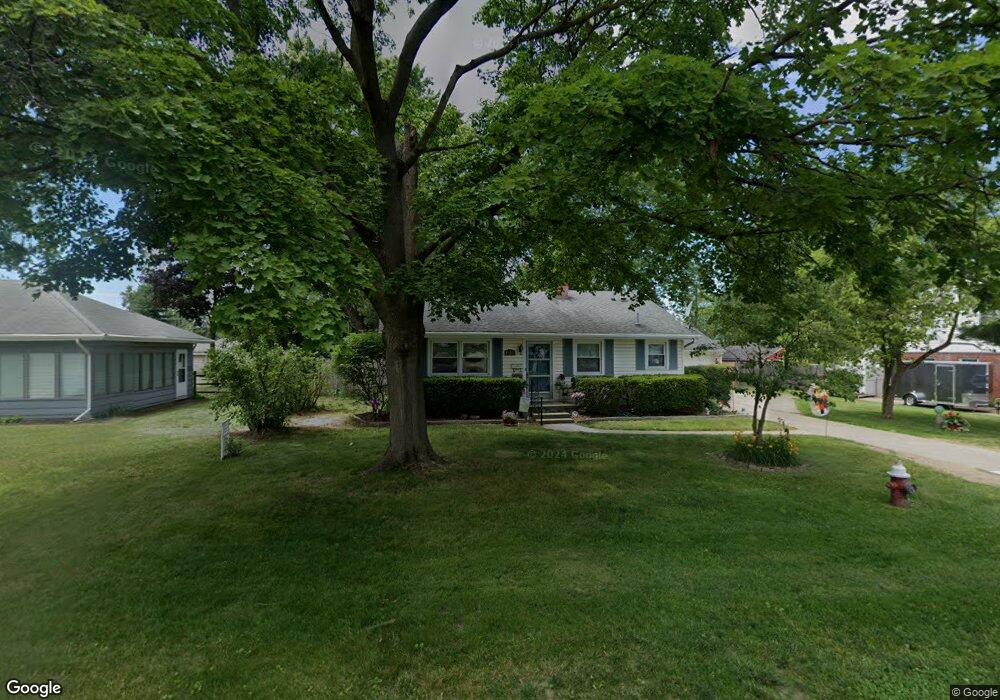
4925 Roywood Rd Toledo, OH 43613
DeVeaux NeighborhoodEstimated Value: $154,000 - $183,000
3
Beds
2
Baths
1,432
Sq Ft
$117/Sq Ft
Est. Value
About This Home
This home is located at 4925 Roywood Rd, Toledo, OH 43613 and is currently estimated at $167,931, approximately $117 per square foot. 4925 Roywood Rd is a home located in Lucas County with nearby schools including Jefferson Junior High School, Washington Junior High School, and Whitmer High School.
Ownership History
Date
Name
Owned For
Owner Type
Purchase Details
Closed on
Nov 18, 2020
Sold by
Community Loan Servicing Llc
Bought by
Equity Trust Company
Current Estimated Value
Purchase Details
Closed on
Nov 13, 2019
Sold by
Szymanski James M and Szymanski James
Bought by
Bayview Loan Servicing Llc
Purchase Details
Closed on
Feb 23, 2007
Sold by
Willier Sandra
Bought by
Szymanski James M
Home Financials for this Owner
Home Financials are based on the most recent Mortgage that was taken out on this home.
Original Mortgage
$76,125
Interest Rate
6.23%
Mortgage Type
FHA
Purchase Details
Closed on
Aug 1, 1989
Sold by
Barton Barbara S
Create a Home Valuation Report for This Property
The Home Valuation Report is an in-depth analysis detailing your home's value as well as a comparison with similar homes in the area
Home Values in the Area
Average Home Value in this Area
Purchase History
| Date | Buyer | Sale Price | Title Company |
|---|---|---|---|
| Equity Trust Company | $89,300 | None Available | |
| Bayview Loan Servicing Llc | $70,000 | None Available | |
| Szymanski James M | $115,000 | Chicago Title Insurance Co | |
| -- | $72,500 | -- |
Source: Public Records
Mortgage History
| Date | Status | Borrower | Loan Amount |
|---|---|---|---|
| Previous Owner | Szymanski James M | $76,125 |
Source: Public Records
Tax History Compared to Growth
Tax History
| Year | Tax Paid | Tax Assessment Tax Assessment Total Assessment is a certain percentage of the fair market value that is determined by local assessors to be the total taxable value of land and additions on the property. | Land | Improvement |
|---|---|---|---|---|
| 2024 | $1,261 | $36,960 | $10,430 | $26,530 |
| 2023 | $2,491 | $31,220 | $7,420 | $23,800 |
| 2022 | $2,460 | $31,220 | $7,420 | $23,800 |
| 2021 | $2,534 | $31,220 | $7,420 | $23,800 |
| 2020 | $3,017 | $32,410 | $7,700 | $24,710 |
| 2019 | $2,179 | $32,410 | $7,700 | $24,710 |
| 2018 | $1,976 | $32,410 | $7,700 | $24,710 |
| 2017 | $3,792 | $29,225 | $8,330 | $20,895 |
| 2016 | $3,968 | $83,500 | $23,800 | $59,700 |
| 2015 | $1,927 | $83,500 | $23,800 | $59,700 |
| 2014 | $2,094 | $29,230 | $8,330 | $20,900 |
| 2013 | $1,396 | $29,230 | $8,330 | $20,900 |
Source: Public Records
Map
Nearby Homes
- 4924 Roywood Rd
- 2623 W Laskey Rd
- 2605 Wyndale Rd
- 2820 Claredale Rd
- 2433 Paradise Ave
- 5211 Douglas Rd
- 2849 W Laskey Rd
- 2344 Mellwood Ave
- 2310 Tremainsville Rd
- 2341 Wernert Ave
- 2728 Castleton Ave
- 4807 Brott Rd
- 2842 Oak Grove Place
- 2285 Fitkin St
- 2408 Lambert Dr
- 4440 Woodmont Rd
- 2224 Olin Dr
- 2409 Lambert Dr
- 2640 Westbrook Dr
- 5338 Amsden Ave
- 4933 Roywood Rd
- 4915 Roywood Rd
- 4937 Roywood Rd
- 4926 Bales Rd
- 4932 Bales Rd
- 4920 Bales Rd
- 4934 Bales Rd
- 4905 Roywood Rd
- 4914 Bales Rd
- 4919 Roywood Rd
- 4938 Bales Rd
- 4928 Roywood Rd
- 4932 Roywood Rd
- 4918 Roywood Rd
- 2543 W Laskey Rd
- 2547 W Laskey Rd
- 4936 Roywood Rd
- 4912 Roywood Rd
- 2555 W Laskey Rd
- 4902 Bales Rd