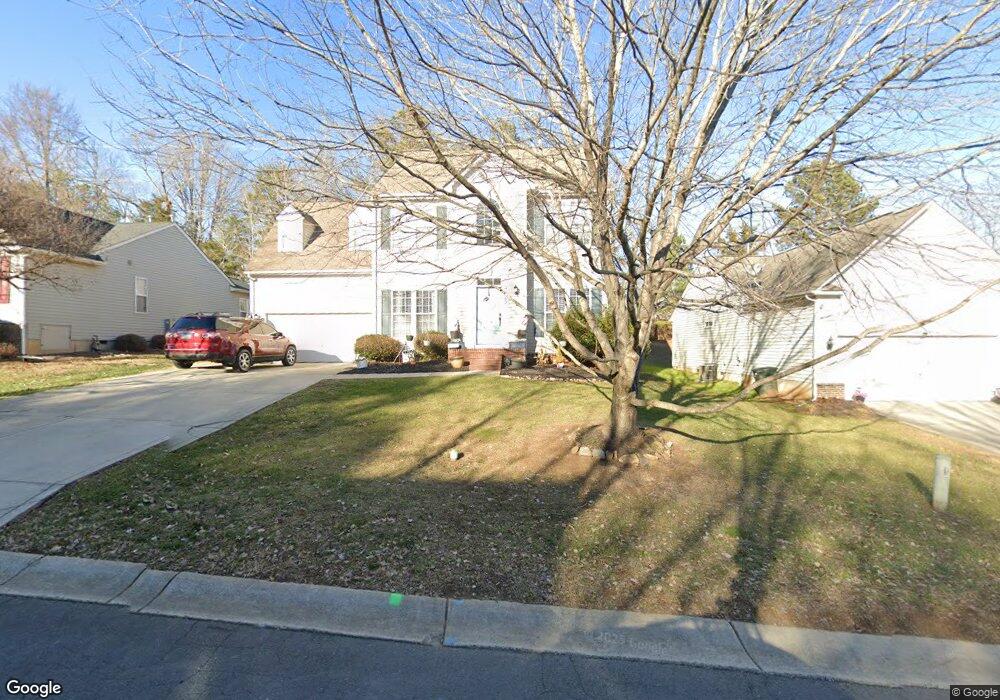
4925 Summerside Dr Clover, SC 29710
Estimated Value: $448,000 - $515,000
4
Beds
3
Baths
2,794
Sq Ft
$174/Sq Ft
Est. Value
About This Home
This home is located at 4925 Summerside Dr, Clover, SC 29710 and is currently estimated at $486,515, approximately $174 per square foot. 4925 Summerside Dr is a home located in York County with nearby schools including Crowders Creek Elementary School, Oakridge Middle School, and Clover High School.
Ownership History
Date
Name
Owned For
Owner Type
Purchase Details
Closed on
Jun 1, 2015
Sold by
Nash Brian A and Nash Jill T
Bought by
Ferguson Jeremy P and Ferguson Bonnie R
Current Estimated Value
Home Financials for this Owner
Home Financials are based on the most recent Mortgage that was taken out on this home.
Original Mortgage
$211,105
Outstanding Balance
$162,807
Interest Rate
3.79%
Mortgage Type
FHA
Estimated Equity
$323,708
Purchase Details
Closed on
May 12, 2005
Sold by
Nvr Inc
Bought by
Nash Brian A and Nash Jill T
Home Financials for this Owner
Home Financials are based on the most recent Mortgage that was taken out on this home.
Original Mortgage
$41,500
Interest Rate
5.8%
Mortgage Type
Stand Alone Second
Purchase Details
Closed on
Feb 9, 2005
Sold by
Piedmont Partners
Bought by
Nvr Inc
Create a Home Valuation Report for This Property
The Home Valuation Report is an in-depth analysis detailing your home's value as well as a comparison with similar homes in the area
Home Values in the Area
Average Home Value in this Area
Purchase History
| Date | Buyer | Sale Price | Title Company |
|---|---|---|---|
| Ferguson Jeremy P | $215,000 | -- | |
| Nash Brian A | $207,710 | -- | |
| Nvr Inc | $60,300 | -- |
Source: Public Records
Mortgage History
| Date | Status | Borrower | Loan Amount |
|---|---|---|---|
| Open | Ferguson Jeremy P | $211,105 | |
| Previous Owner | Nash Brian A | $41,500 | |
| Previous Owner | Nash Brian A | $166,150 |
Source: Public Records
Tax History
| Year | Tax Paid | Tax Assessment Tax Assessment Total Assessment is a certain percentage of the fair market value that is determined by local assessors to be the total taxable value of land and additions on the property. | Land | Improvement |
|---|---|---|---|---|
| 2025 | $1,496 | $10,924 | $1,869 | $9,055 |
| 2024 | $1,342 | $9,499 | $2,022 | $7,477 |
| 2023 | $1,376 | $9,499 | $2,022 | $7,477 |
| 2022 | $1,134 | $9,499 | $2,022 | $7,477 |
| 2021 | -- | $9,499 | $2,022 | $7,477 |
| 2020 | $1,075 | $9,499 | $0 | $0 |
| 2019 | $1,020 | $8,260 | $0 | $0 |
| 2018 | $1,025 | $8,260 | $0 | $0 |
| 2017 | $955 | $8,260 | $0 | $0 |
| 2016 | $4,011 | $12,390 | $0 | $0 |
| 2014 | $983 | $7,240 | $1,520 | $5,720 |
| 2013 | $983 | $8,620 | $1,520 | $7,100 |
Source: Public Records
Map
Nearby Homes
- 4913 Summerside Dr
- 1041 Pepperwood Place
- 630 Springhouse Place
- 128 Autumn Falls Dr
- 115 Autumn Falls Dr Unit 34
- 318 Shingleoak Dr
- 334 Embers Ln
- 1243 Pebble Grove Dr Unit 442
- 2129 Salem Dr Unit 5
- 912 Elderberry Ln
- 5650 Riverfront Rd
- 715 Cider Ct
- 2068 Paddlers Cove Dr
- 559 Daventry Ct
- 1911 Marlin Dr
- 1715 Curtis Dr
- 116 Kentmere Ln
- 5165 Sapp Cir
- 770 Cooks Cove Ridge
- 4083 Home Grown Way
- 4921 Summerside Dr
- 4929 Summerside Dr
- 4933 Summerside Dr
- 4917 Summerside Dr
- 4924 Summerside Dr
- 535 Granite Way
- 4928 Summerside Dr
- 4932 Summerside Dr
- 4914 Summerside Dr
- 4936 Summerside Dr
- 4940 Summerside Dr
- 4909 Summerside Dr
- 4164 Autumn Cove Dr
- 4166 Autumn Cove Dr
- 4162 Autumn Cove Dr
- 4905 Summerside Ln
- 4170 Autumn Cove Dr
- 4944 Summerside Dr
- 511 Granite Way
- 4941 Summerside Dr
Your Personal Tour Guide
Ask me questions while you tour the home.